Data labels display source data in a chart. They make it easy to understand the chart.
Example
This tutorial shows how to add data labels to a chart and remove them if they make it look untidy.
How to Add Data Labels to a Chart
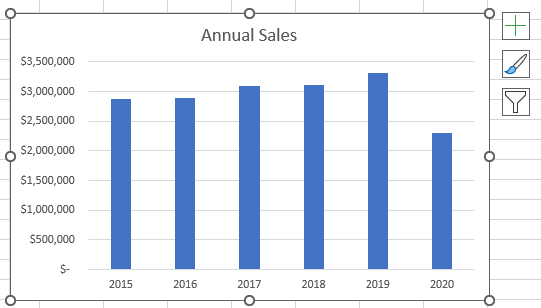
By default, data labels are not added to a chart when you insert it in Excel. We need to add them to make the chart easy to understand.
Example #1: Add a Data Label to One Data Point
In case you want to add a data label to only one data point in the chart, you use the steps below:
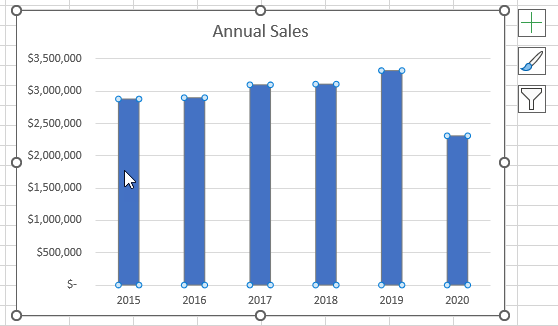
- Click the data series.
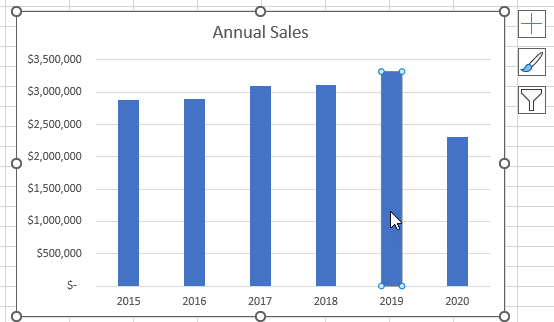
- Click the data point you want to label.
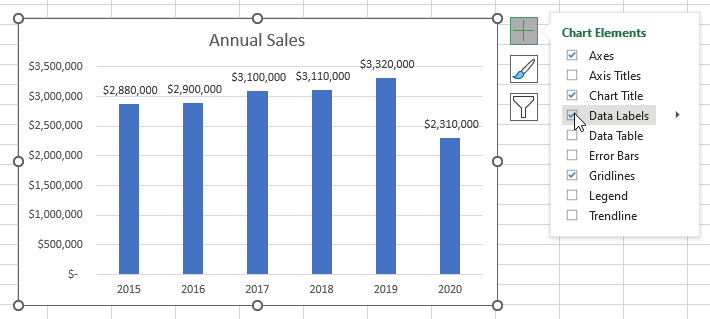
- Click the Chart Elements button on the top right corner of the chart.
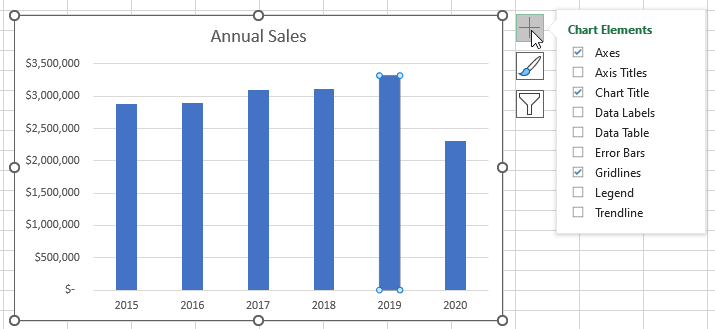
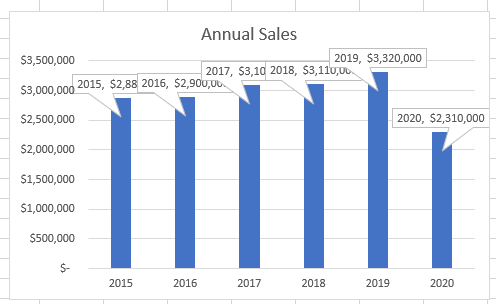
- Hover the mouse pointer over the Data Labels option. Click the small black arrow. The flyout menu appears. Hover over each option on the menu and see its preview in the chart. Select the option you like.
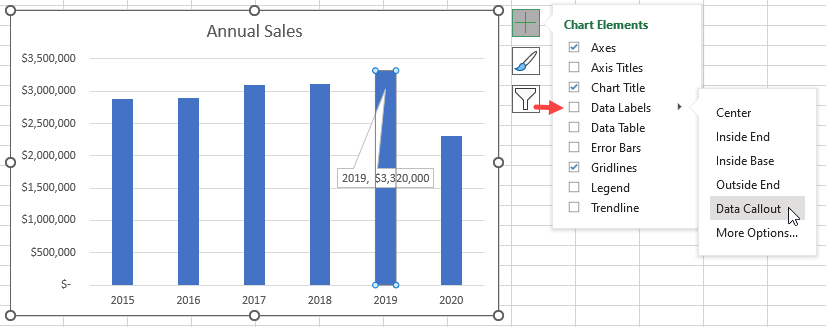
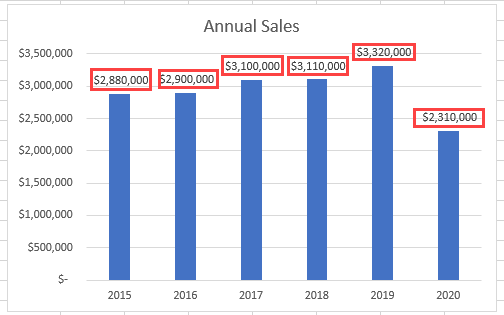
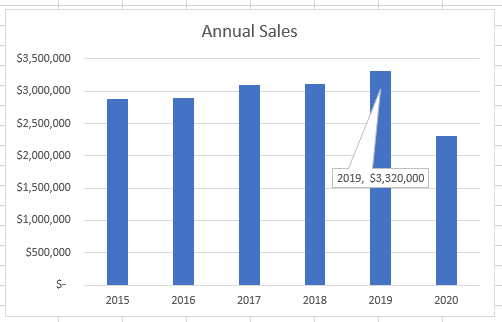
The label you chose appears in the chart.
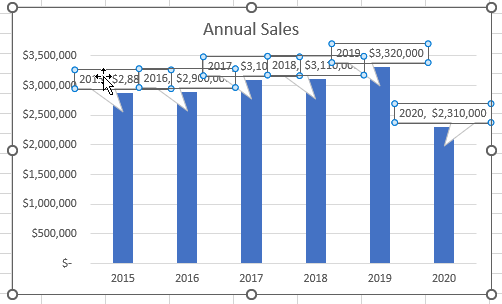
Example #2: Add Data Labels to All Data Points
To label all data points in a chart, you use the steps below:
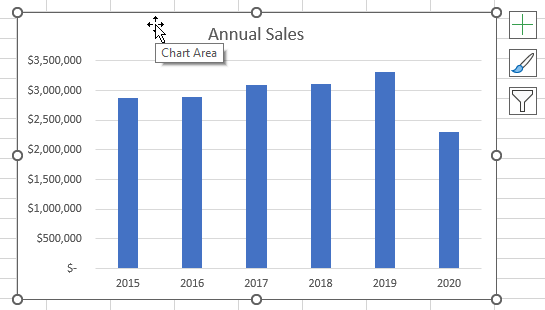
- Click just below the top edge of the chart to select the chart.
- Click the Chart Elements button on the top right corner of the chart.
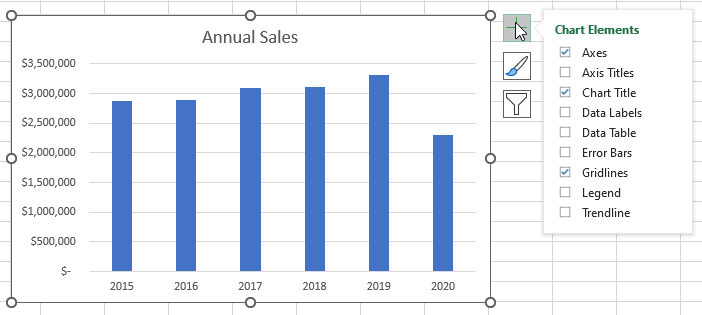
- Select the Data Labels option. Labels are added to all the data points.
How to Remove Data Labels in Excel Chart
Sometimes data labels can make your chart look cluttered.
You can remove the data labels using the following techniques:
Use the Ribbon
- Click just below the top boundary of the chart to select it and activate the Chart Design tab.
- Click Chart Design >> Add Chart Element >> Data Labels >> None.
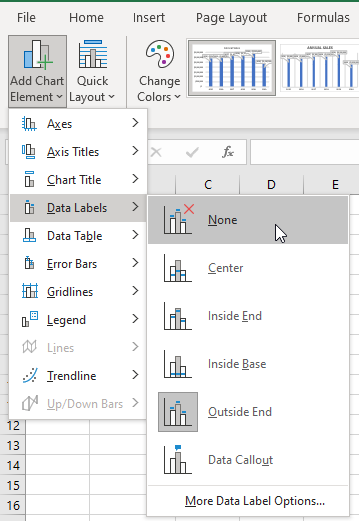
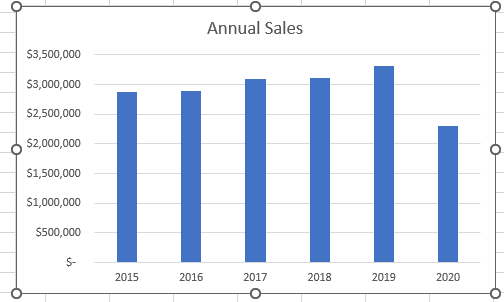
All the data labels are removed.
Select the Data Labels and Delete
- Click a single label. All the labels are selected.
- Press the Delete key. All labels are deleted.

Right-click a Data Label and Delete
- Right-click any of the labels and click Delete on the shortcut menu that appears.
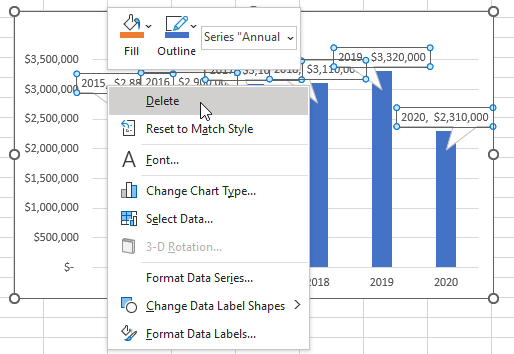
The labels are removed from the chart.
Undo the Labels
Immediately after adding labels to the chart, you can remove them by:
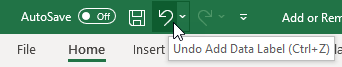
- Press Ctrl + Z.
- Click the Undo button on the Quick Access Toolbar.
Conclusion
This tutorial has shown various techniques for adding and removing data labels in an Excel chart. We trust that you found the information helpful.