As we work with Excel, we may want to calculate the mode (most frequently occurring value) in a Pivot Table. This tutorial shows how to calculate the mode in a Pivot Table in Excel.
How to Calculate the Mode in a Pivot Table
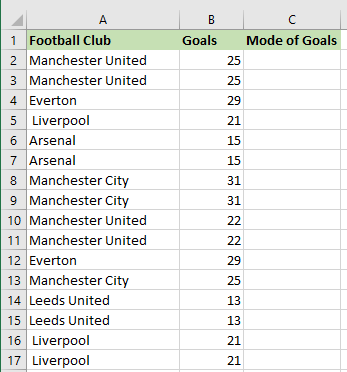
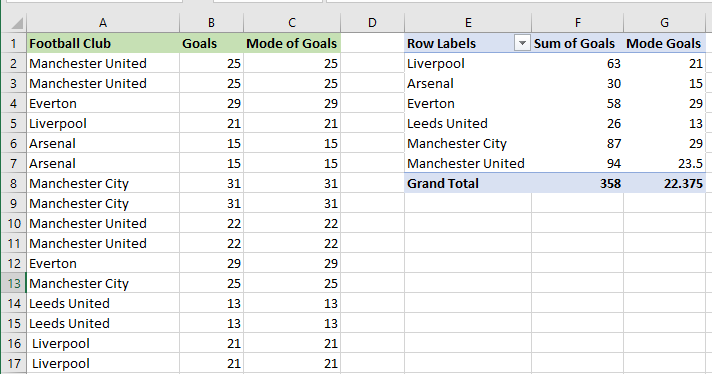
Let’s consider the following dataset showing the number of goals scored by respective football clubs in various seasons.
We use the following steps to calculate the mode of goals scored by each football club in a Pivot Table:
Step #1: Compute the Mode by Group
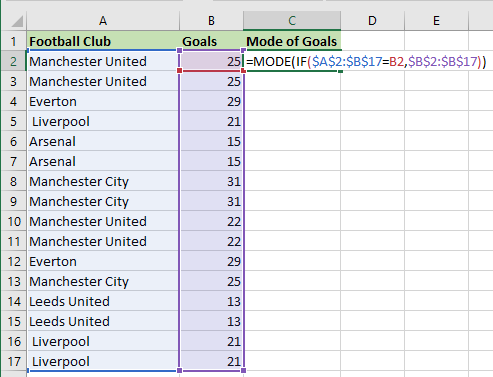
Excel has no built-in feature for calculating the mode, but we can use a formula combining the MODE and IF functions as a workaround.
We proceed as follows:
- Select cell C1 and enter the following formula:
|
1 |
=MODE(IF($A$2:$B$17=B2,$B$2:$B$17)) |
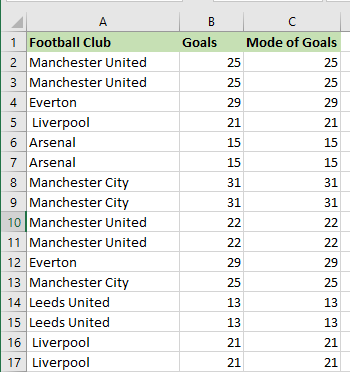
- Drag or double-click the Fill Handle to copy the formula down the column.
Step #2: Create the Pivot Table
Use the steps below to create the Pivot table:
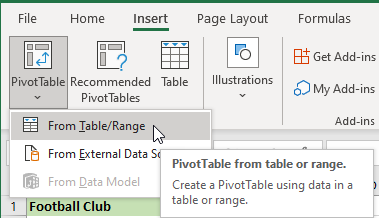
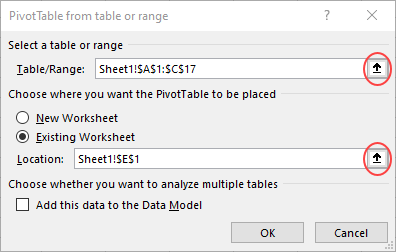
- Click Insert >> Tables >> PivotTable >> From Table/Range.
- On the PivotTable from table or range dialog box, use the range selector on the Table/Range box to select the entire dataset in cell range A1:C17. Next, click the range selector on the Location box to select cell E1, and click OK.
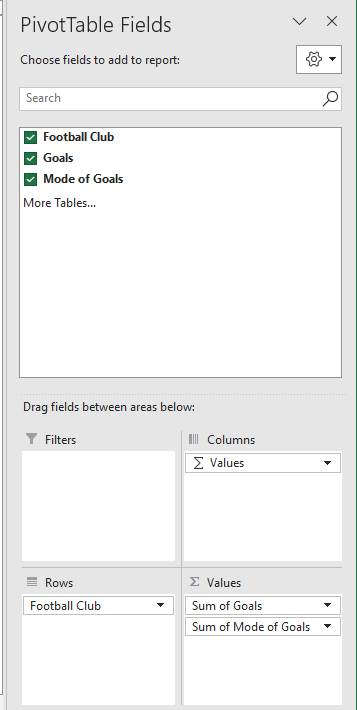
The PivotTable Fields pane appears on the right of the Excel window.
- On the PivotTable Fields pane, drag the Football Club field to the Rows box, then drag the Goals and Mode of Goals fields to the Values box.
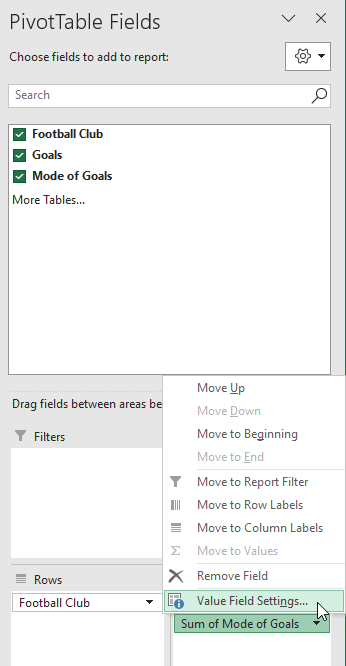
- On the Rows box, click the down arrow next to Sum of Mode of Goals and choose Value Field Settings.
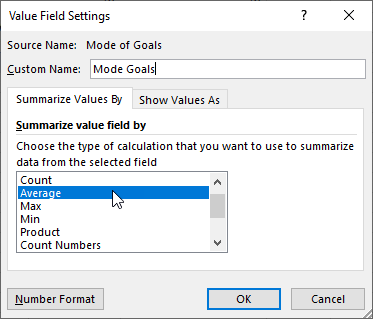
- On the Value Field Settings dialog box, change the Custom Name to Mode Goals, select Average as the summary value, and click OK.
The Pivot Table shows each unique football club, the sum of goals scored by each club, and the mode of goals scored by each club.
Conclusion
This tutorial showed how to calculate the mode in a Pivot Table. We hope you found the tutorial helpful.