A time series chart visualizes numeric data and displays data points at successive intervals. Each data point corresponds to time being tracked and quantity being measured.
Example Chart
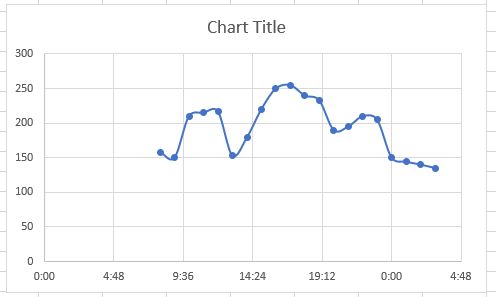
In this tutorial, we will show you two ways of creating a time series chart by showing you the steps of creating the following example chart:
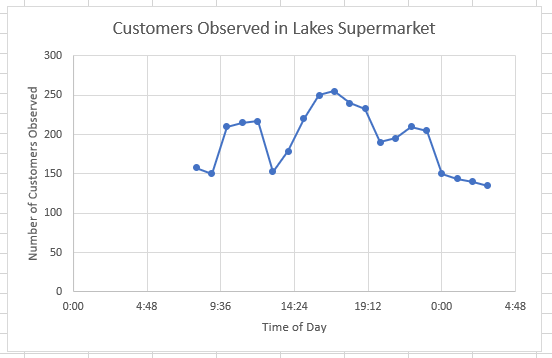
The example chart shows the number of customers observed in a supermarket at different intervals.
Way 1: Use a Recommended Chart
We use the steps below:
- Enter the following data in an Excel worksheet.
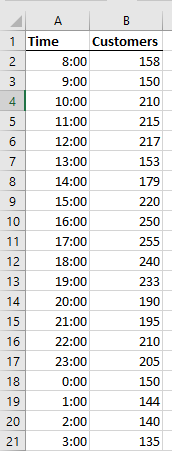
- Select the dataset, including the column headers.
- Click Insert >> Charts >> Recommended Charts >> Scatter, and click OK.
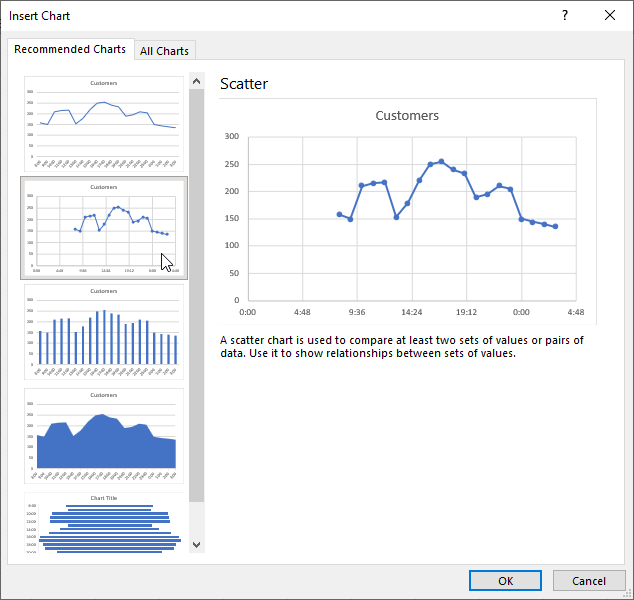
The time series is inserted immediately.
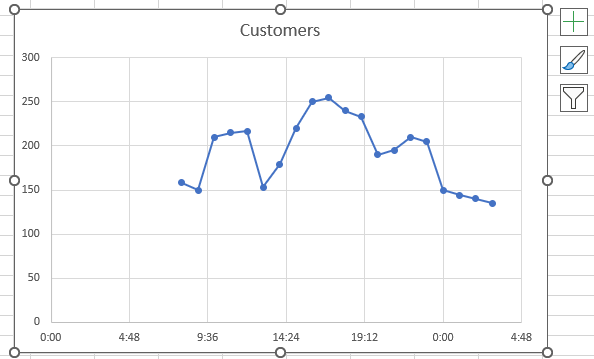
The x-axis shows the time when the observation was done, and the y-axis shows the number of customers observed.
Customize the Chart
We customize the time series chart by doing the following:
- Click just below the top boundary of the chart. This selects the chart.
- Click the Chart Elements button on the top right corner of the chart.
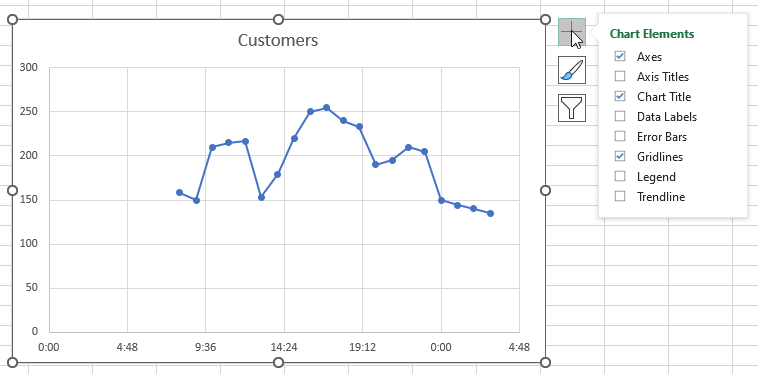
- Select the Axis Titles option. This places placeholder labels on the x-axis and y-axis.
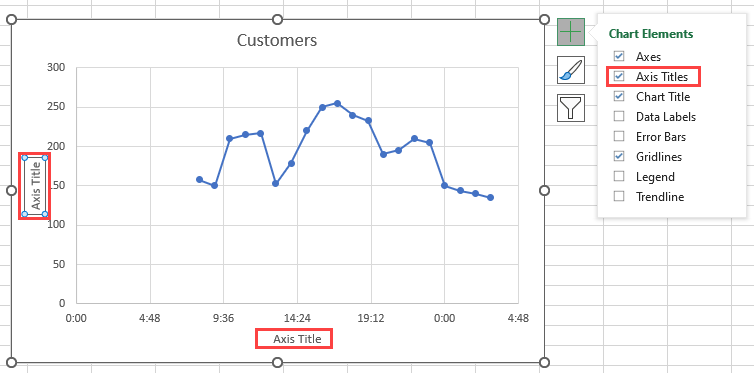
- Select the text in the placeholder label on the y-axis and replace it with “Number of Customers Observed.” Select the text in the placeholder label on the x-axis and replace it with “Time of Day.” Change the chart title to “Customers Observed in Lakes Supermarket.”

The chart is now complete.
Way 2: Use the Scatter Charts drop-down
We use the following steps to create the chart:
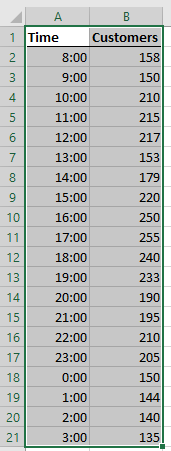
- Enter the following source data in an Excel worksheet.

- Select the dataset, including the column headers.

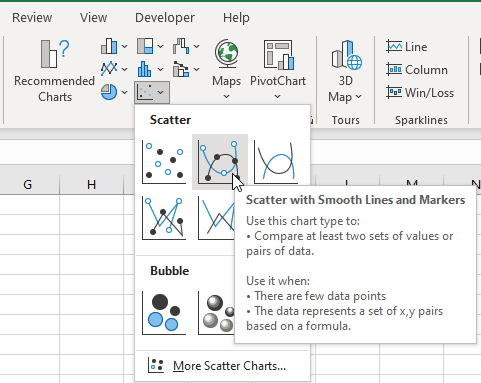
- Click Insert >> Charts >> Scatter with Smooth Lines and Markers.
The time series chart is inserted immediately.
The x-axis shows the time when the observation was done, and the y-axis shows the number of customers observed.
- Customize the chart as explained previously in this tutorial.

The time series chart or graph is now complete.
Conclusion
We use a time series chart to visualize data points at successive intervals. This tutorial showed two ways of creating a time series chart in Excel. We hope you found the information helpful.