You should use a trendline formula only with XY Scatter chart, because this chart plots on both X and Y axis as values, contrary to other charts, like Column, Line, or Bar, which plots only on the Y axis as values. Therefore, the trendline won’t be accurate for these types of charts.
Find the equation of a trendline
In order to display the Equation of a trendline, follow these steps.
- Select all data inside a table.
- Navigate to Insert >> Charts and select Scatter Chart.

- Right-click the Data Series and select Add trendline.
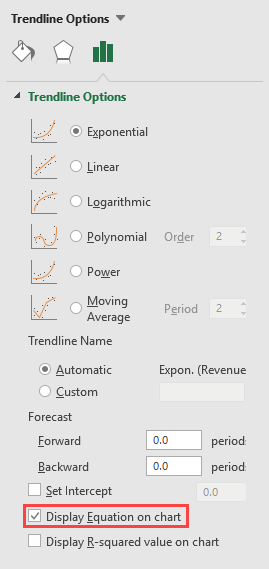
- Select the trendline type.
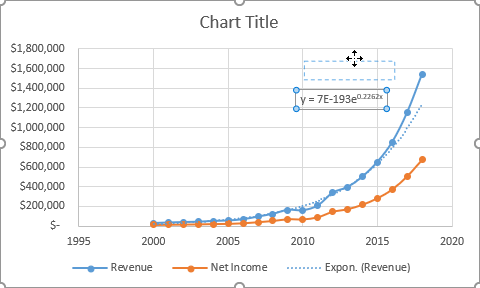
- Check Display
Equation on the chart.
Depending on the trendline type, you are going to get different types of equations.
After you add the equation, you can change its position by dragging.