In Excel, a lot of times people have issues with formatting. Knowing the tips and tricks of formatting can get you a long way.
In the example that follows, we will show how to format percentages in Excel.
Format Existing Values as Percentages in Excel
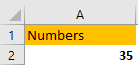
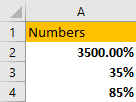
Suppose that we have a random number, let us say 35.
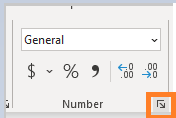
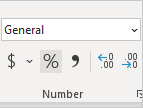
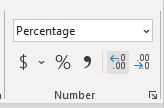
We will go on to the Home tab, and click on the Number Format button:
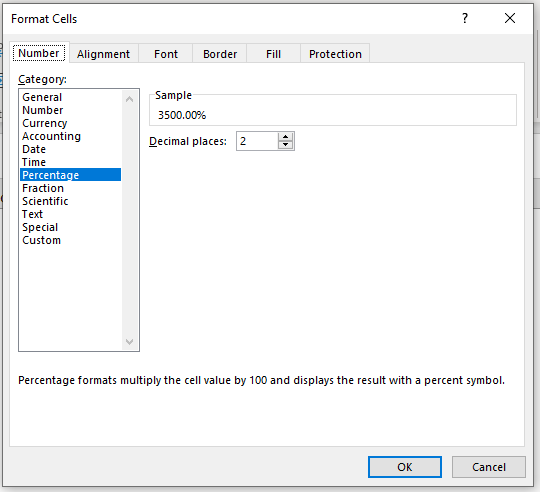
Once we click on it, we will go to the percentage tab, and we will see that our number will be formatted as 3500%.
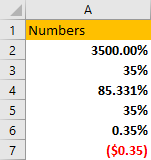
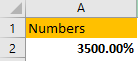
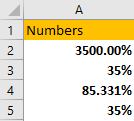
We will click OK and have this number: 3500.00%:
The reason why this happens is that, when you have a certain number, and you apply percentages on it, Excel will multiply this number by 100 and will add a percentage sign automatically.
In our example, the number 35 was first multiplied by 100, and then the percentage was added.
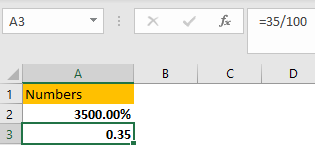
Unless you wanted a percentage of 3500.00% and not 35%, you are probably surprised by this result. To work around this issue, we can first divide this number by 100, before we apply the percentage formatting.
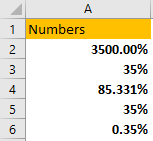
This way, we will have a number 0.35 as our result:
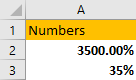
Then we need to format this number as a percentage.
The other way is to type in the number 0.35 directly. Now, when we format this number as a percentage, we will get the expected number, which is 35%.
Of course, we can always type the number that we want- i.e. just go to the cell we want and simply type 35%.
Rounding the Percentages
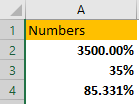
We will type the number 0.85331 in cell C4. Let us say that we want this number presented in percentages in full (every decimal). We will select this cell and just go on and click on the percentage icon in the Home tab:
We will notice that we did not get the full number that we wanted:
To get our number, all we need to do is increase decimal places. We will select our number and then click on the Increase Decimal icon as many times needed (in our case three times):
To decrease decimals, we need to simply click on the icon to the right (Decrease Decimal).
Our number seems alright now:
Pre-format Empty Cells
We can always define our formatting before we even start entering the numbers. We will click on cell A5 and define the format to be percentages.
If we type numbers that are larger or equal to 1, these are converted automatically. For smaller numbers than 1, we have two scenarios- if they do not have preceding zero, they are then multiplied by number 100 and converted to percentages. If they have, then they will be converted to percentages.
This means that, if we want to get a percentage of 35%, we can type in simply 35 or .35.
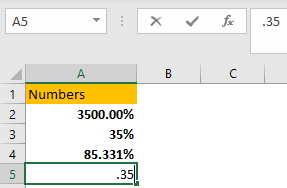
In both cases, we will get numbers of 35%.
If we type 0.35, however, we will get 0.35%.
Formatting Negative Percentages
If we have negative percentages, we can format them in various ways, by going to Custom formatting.
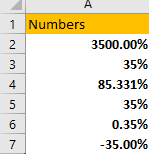
Let us say that we have a number -35.00% in cell A7.
If we want to format this number, we will select it, then go to the Number formatting. We will select the Custom tab, and then choose one of many options that we have:
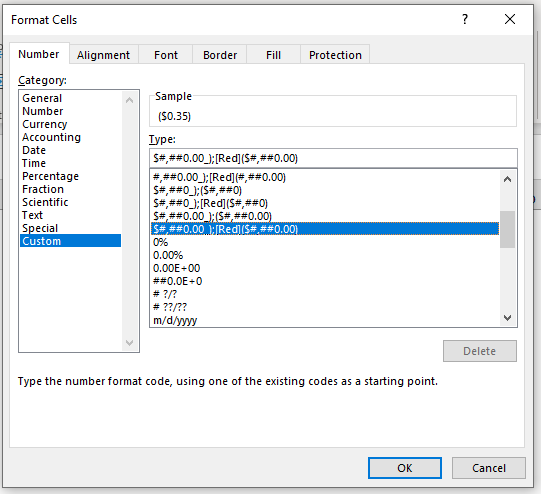
For our example, we will choose the option as in the picture above, and will have the following result: