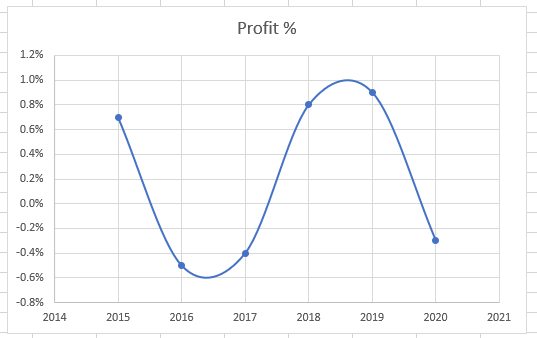
Sometimes when we create a graph in Excel, and the Y-axis has both positive and negative values, the X-axis appears in the middle instead of at the bottom of the chart as we would ordinarily want it. The following example graph has the X-axis in the middle of the graph instead of at the bottom: 
This tutorial uses the example graph above to show two techniques for moving the X-axis to the bottom of a chart in Excel.
Method #1: Move X-axis to the Bottom of the Graph by Changing the Horizontal Axis Value
We can move the X-axis to the bottom of the graph by changing the value of the horizontal axis.
Suppose we have the following graph with the X-axis in the middle of the chart.

We want to move the X-axis to the bottom of the graph by adjusting the value of the horizontal axis.
We can move the X-axis to the bottom of the graph using the following steps:
- Select the chart we want to modify.
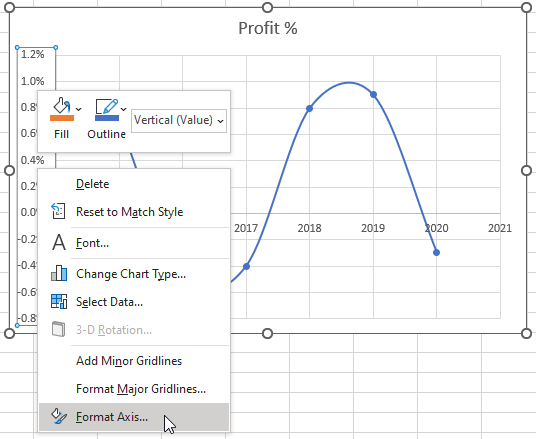
- Right-click the Y-axis and choose Format Axis on the shortcut menu that appears.
- Select the Axis value option on the Format Axis pane on the right of the Excel window and type the value -40 in the box next to it.
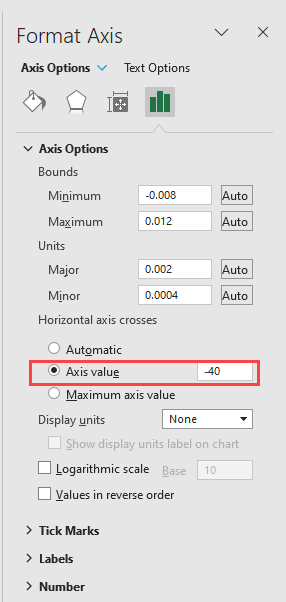
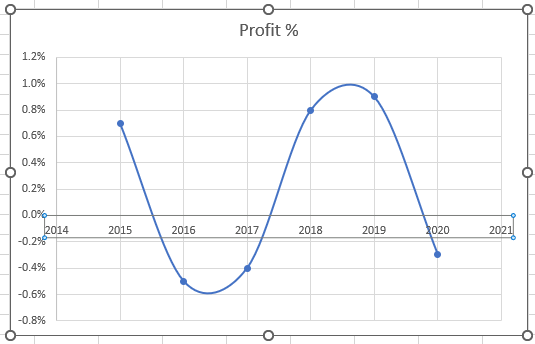
The X-axis is moved to the bottom of the graph.
- Press Ctrl + S or click the Save button on the Quick Access Toolbar to save the changes.

Method #2: Move X-axis to the Bottom of the Graph by Moving the Position of the Labels
In Excel, we can move the X-axis to the bottom of a graph by changing the position of the X-axis labels.
Presume we have the following Excel graph with the X-axis in the middle of the chart rather than at the bottom.
We want to move the X-axis to the bottom of the graph using the Format Axis pane.
We use the below steps:
- Select the graph we want to adjust.
- Right-click the X-axis and select Format Axis on the shortcut menu that appears.
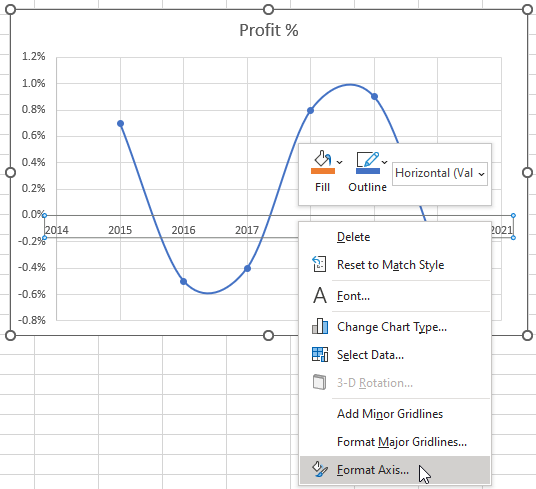
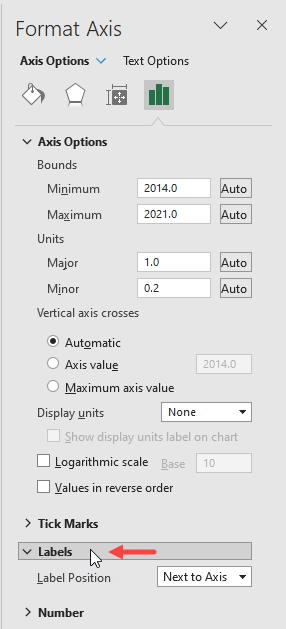
- Select Labels on the Format Axis pane on the right of the Excel window.
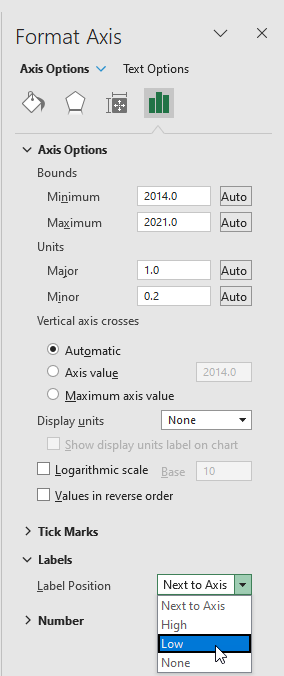
- Open the Label Position drop-down and select Low.
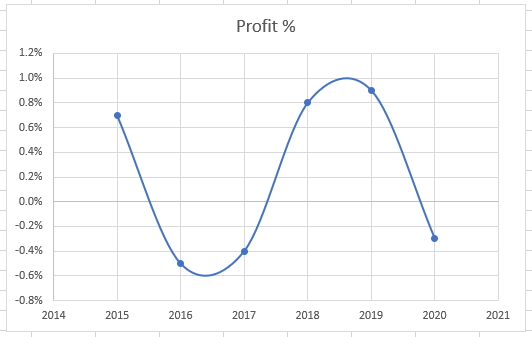
The labels of the X-axis are moved to the bottom of the graph.
- Press Ctrl + S or click the Save button on the Quick Access Toolbar to save the changes.
Conclusion
This tutorial showed two methods for moving the X-axis to the bottom of a graph in Excel. We hope you found the tutorial helpful.