Pivot tables are a great tool for visually presenting our data and for extracting certain data from a larger scope.
We can play around with a lot of different tools and options regarding Pivot tables. In the example below, we will show how to insert and edit the Pivot table, and then present only the top 10 results that have more values than this number.
Insert and Edit Pivot Table
For our example, we will use the list of NBA players and their statistics from one game:
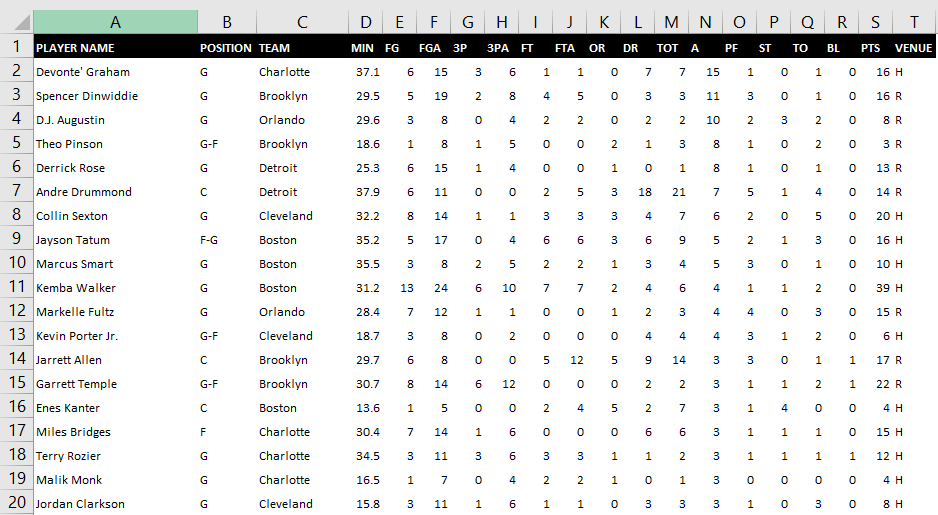
The table is larger, but we decided to show only the first part of it. This table has 65 rows.
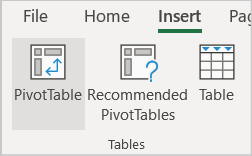
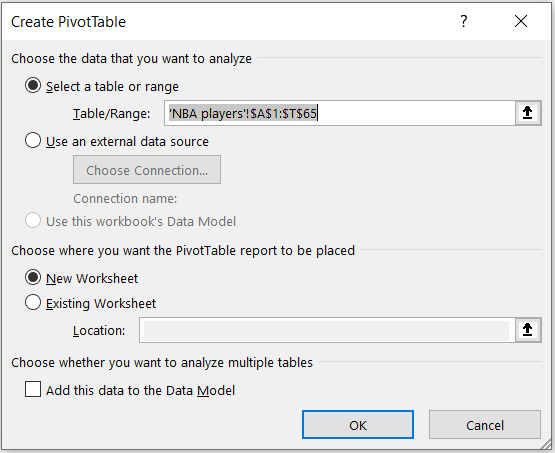
To create the Pivot table, we will select our table (columns A:T), then go to Insert >> PivotTable:
On the window that appears, we can simply click OK, and our Pivot table will be created in a separate sheet:
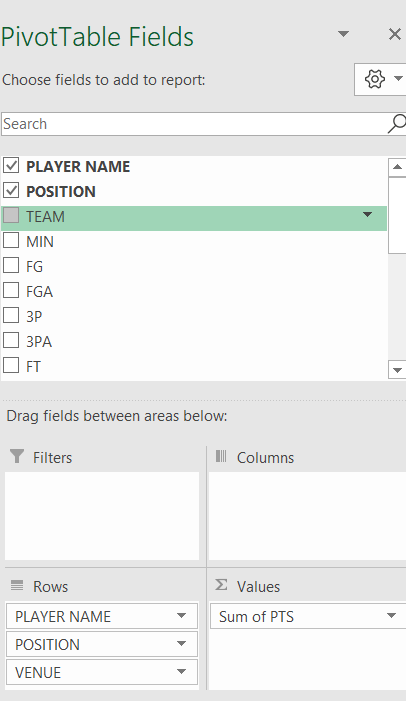
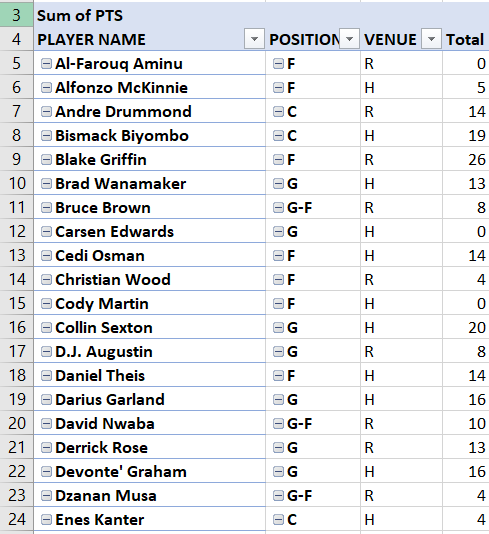
Now that we have our table, we will choose a Player name, Position, and Venue for our Rows field, and Points for Values field:
At this point, our Pivot table looks like this:

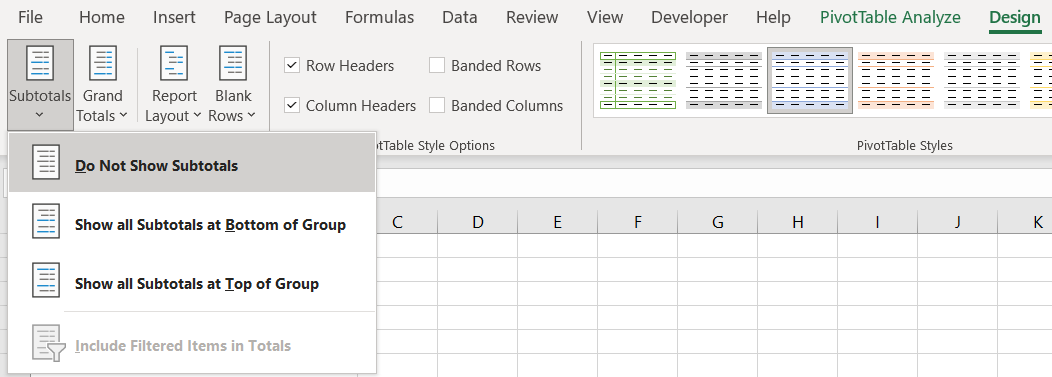
To make it look neater, we will click on it, go to the Design tab, and then choose Layout >> Do Not Show Subtotals:
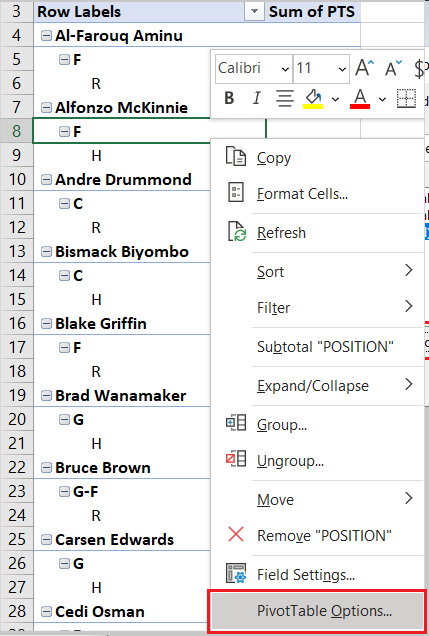
Next, we will select the Pivot table, right-click on it, and choose PivotTable Options:
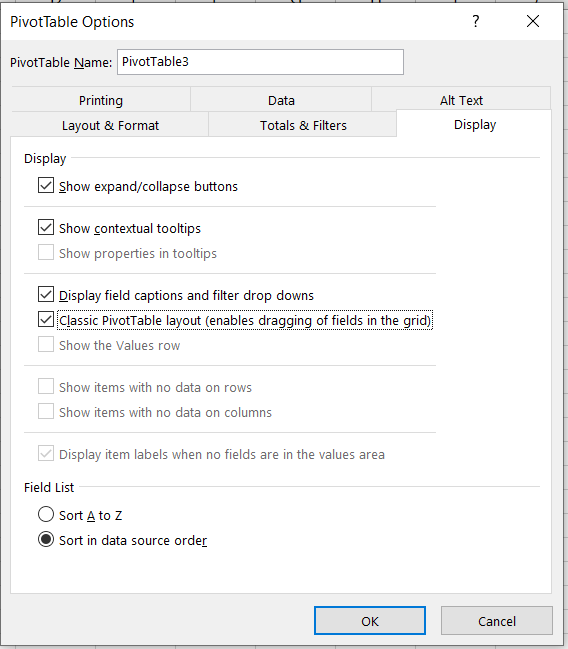
On the window that appears, we will go to the Display tab, and choose Classic PivotTable layout:
Now we will get the “normal” view of our table:
Show Top 10 Results in a Pivot Table
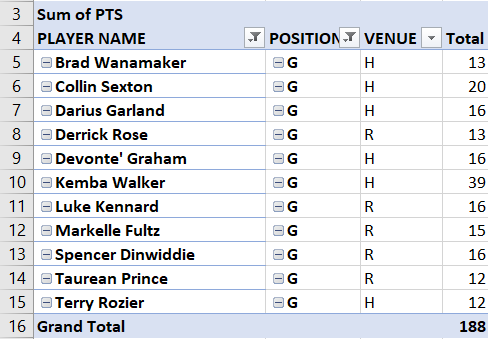
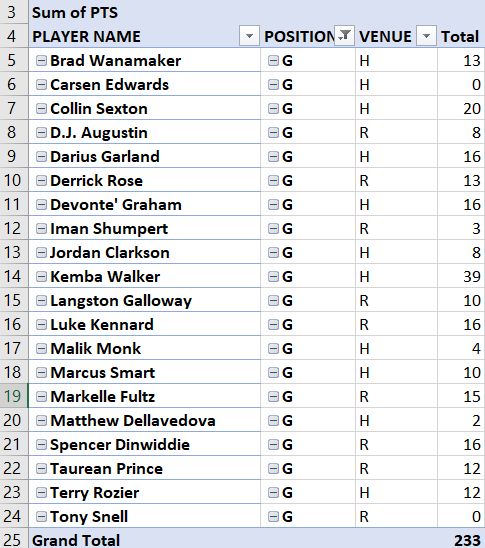
Now we will filter our results by position (we will include only guards- letter G), and will be left with 20 players:
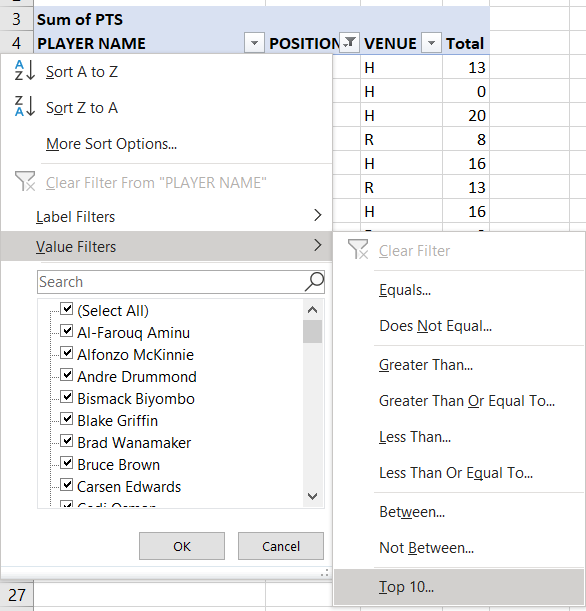
To show only the top 10 results (guards) in terms of points, we will go to the first dropdown (the one next to the player name), choose Value Filters, and then choose Top 10:
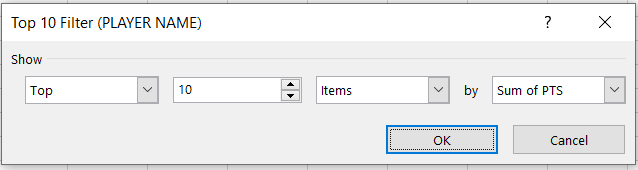
After we click here, we will be presented with a top 10 filter, in which we can choose: 1) Top or Bottom; 2) Number of Items; 3) Choose among items, percent, and sum, and 4) Field from which we want our top results to be shown:
In our case, it all looks good, so we can simply click OK. In the end, our table will look like this: