Sometimes we can stumble upon different problems in Excel, and it is important to know how to handle them once we get to them.
One of the things that can cause a lot of problems is certainly charts. For multiple reasons, they can be empty. We will explore why in the text below.
Why Are My Charts Blank in Excel
Some of the reasons why we can have empty charts are as follows:
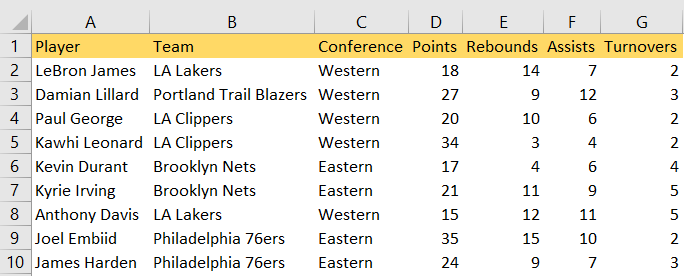
- No data. The first reason why the chart will not show is that we did not choose any data. For our example, we will use the list of NBA players, their respective teams and conferences, and their statistics from one playing night (points, rebounds, assists, and turnovers):
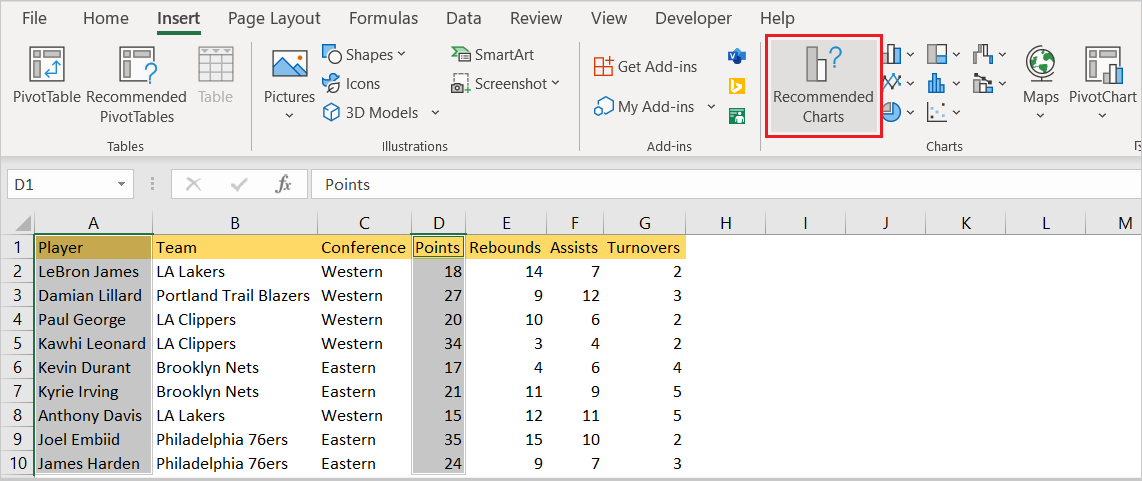
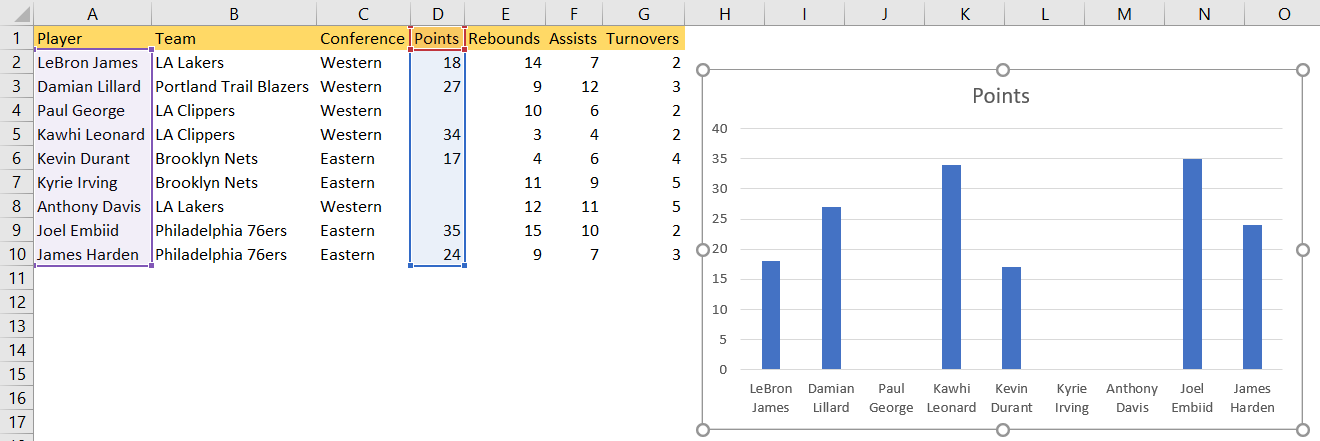
We will select data in columns A and D for our Chart and then go to Insert >> Charts >> Recommended Charts:
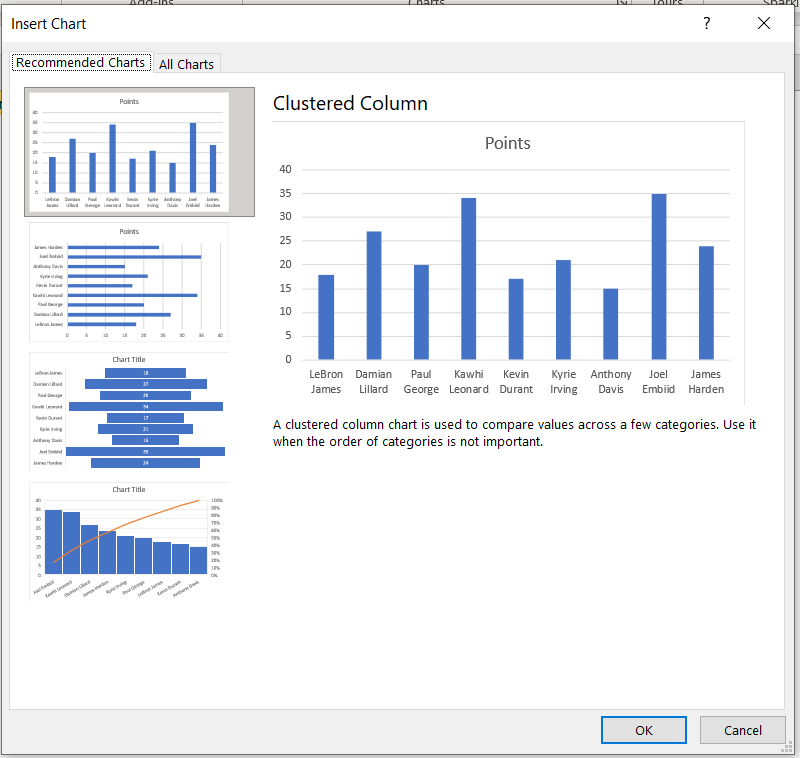
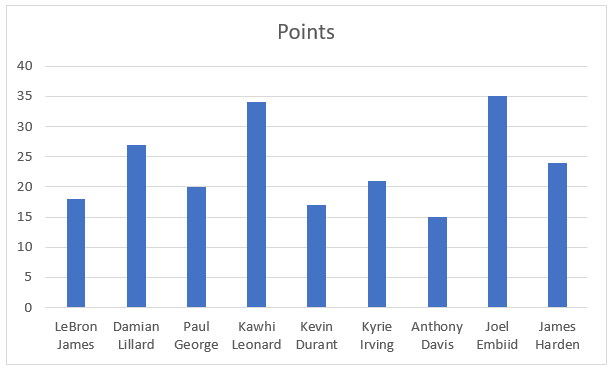
We would choose the first option presented to us in a pop-up window, which will be Clustered Column:
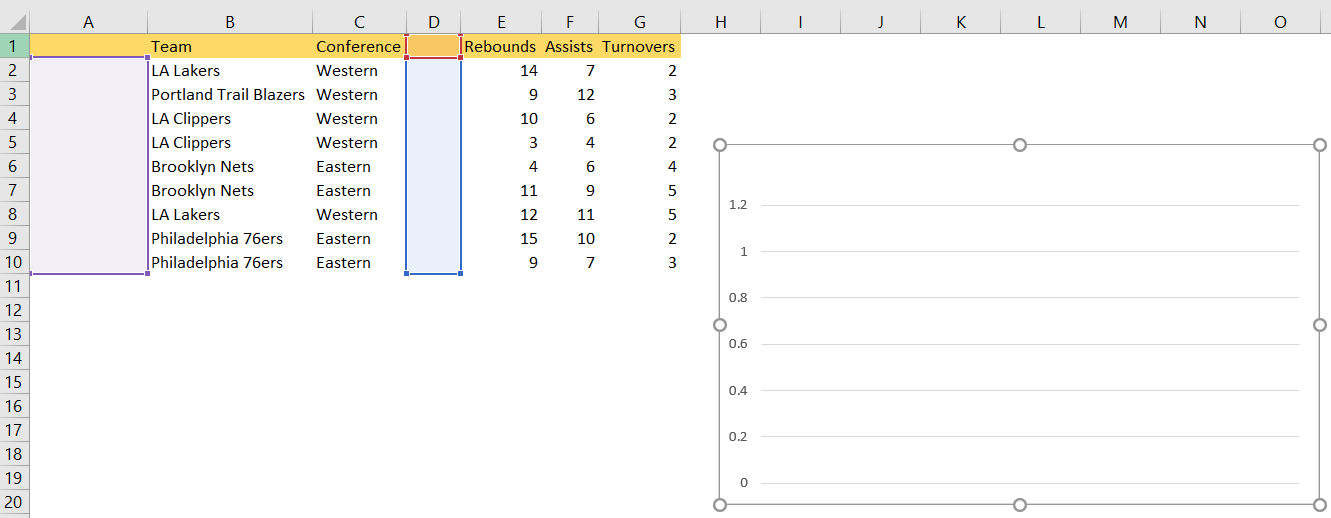
When we click OK, we would have the same chart as in the preview created. If we would, for whatever reason, deleted the data in columns A and D, we would have a blank chart:
- Wrong chart type. For some data, specific charts are inappropriate and cannot be used. If we try to change the type of our data (columns A and D) and choose Map, we will see no data available:

Another example would be if we had categorical data. In that case, a line chart would not be a good idea.
- Hidden Data. We can also be in a situation where we have our data hidden. We will use the same columns- columns A and D, and create a simple Clustered Column chart:
If we (or anyone else for that matter) decides to hide column D (by selecting it, then right-clicking on it and choosing Hide):
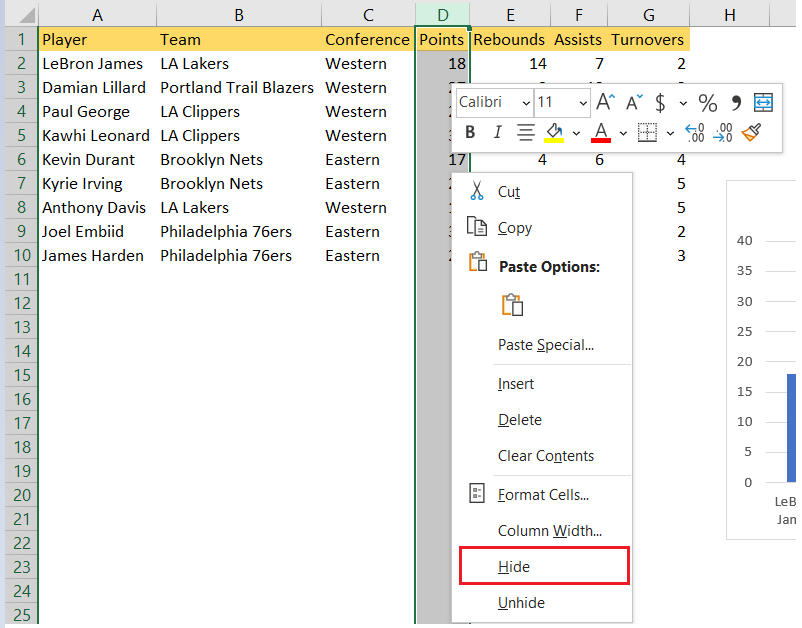
We would immediately lose the data from our chart:
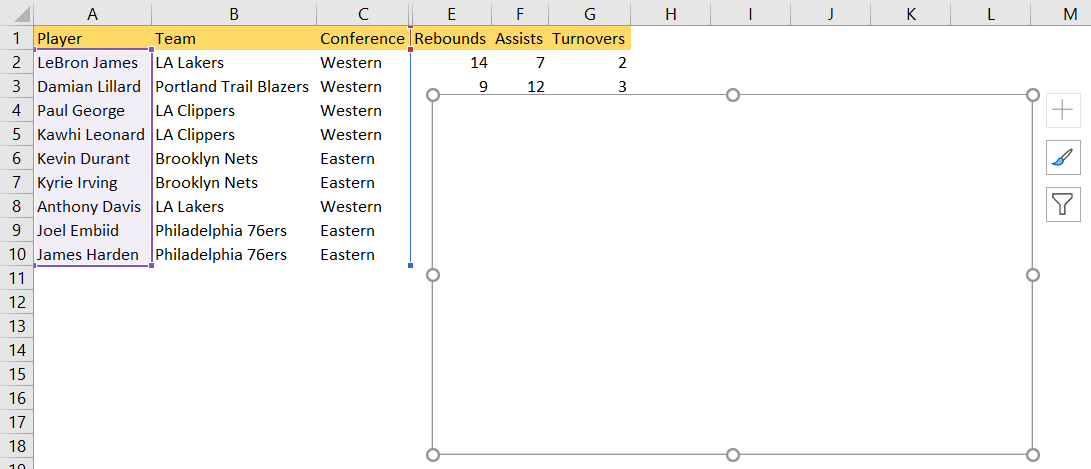
To get the nice overview back, we would need to unhide the data.
- Empty Cells. If we, for whatever reason, do not have all of the cells populated, we are not going to have, logically, any data in our chart as well. To show this in the example, we will delete the data for points on rows 4, 7, and 8. This chart will look a little bit different:
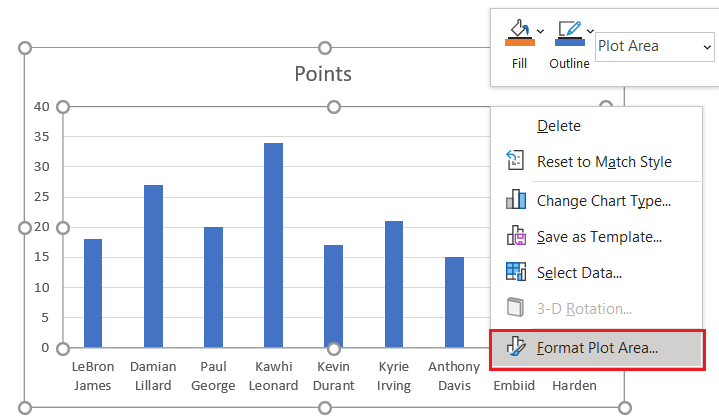
- Formatting Issues. Sometimes the charts can have formatting settings that can cause them to appear blank. You can always inspect the chart by right-clicking on it, and choosing “Format Plot Area” to inspect the possible issues:
- Compatibility. Lastly, if you use an older Excel version or try to open a file that is saved in a different version, you might stumble upon compatibility issues. If this happens, try changing the file format or opening it on another computer.