Excel is one of the best tools devised for various calculations. Formulas in Excel are grouped into multiple subcategories: mathematical, financial, date & time, and many others.
In the example below, we will show how to use one of the formulas from the statistical group, NORM.INV and PERCENTILE. These and some other formulas will help us calculate the mean, standard deviation, and percentile.
Standard Deviation, Mean, and Percentile
To understand the formulas that we will show, we need to understand all the terms that they relate to.
In simple terms, the mean represents the average of the set of particular values. We use the symbol μ (a Greek letter) to present it.
A standard deviation (or σ) shows us how dispersed is our data in relation to the mean. When the standard deviation is low, it means that the data are clustered or grouped around the mean, and when it is high, it means that the data are spread out.
Standard deviation percentiles are a good indicator that shows us the percentage in the data set below or above the average. In what is called normal distributions, 50 percent of all the data will be less or greater than the average.
Calculate Percentile Value When The Values are Known
Suppose that we have a car manufacturer that can guarantee a standard car part for 20,000 miles, with a standard deviation of 2,000 miles. Now we want to know for how many miles should the company warranty its parts if it does not want to replace more than four percent of the parts.
We will use the simple formula: NORM.INV for this purpose, since all three needed values are known to us. This is our result:
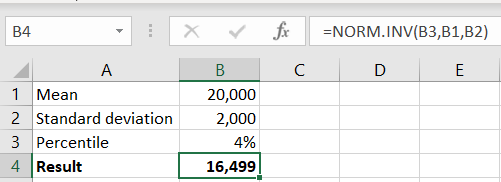
NORM.INV has three parameters: probability, mean, and standard deviation. Since we have all of them, we simply insert all of these values in the formula.
Calculate Mean, Standard Deviation, and Percentile
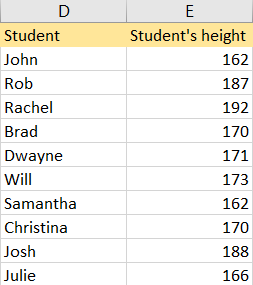
To calculate the percentile from our data set, we do not need to know the mean and standard deviation. In Excel, there is one simple formula that can give us the results of percentile in our range. Suppose that we have the following data set:
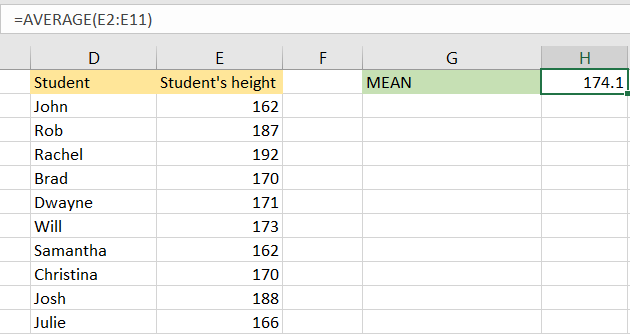
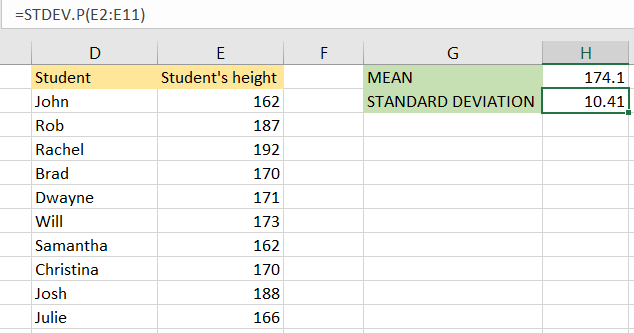
To calculate the Mean for this range, we will use the AVERAGE formula:
For Standard deviation calculation, we will use the STDEV.P formula with our data set:
As we said, the percentile gives us the percentage of results that fall under a certain value. Using the percentile, we can find the relative position of a certain value in our range. For our example, we will use the 75th percentile of our data. We will use the following formula:
|
1 |
=PERCENTILE.INC(E2:E11,0.75) |
As seen, PERCENTILE has two parameters: array (our range), and k (a number between 0 and 1 that represents the percentile we want to get).
When we insert our formula, this is the number that we will get:
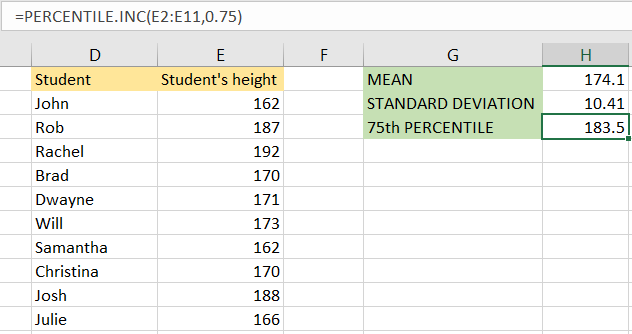
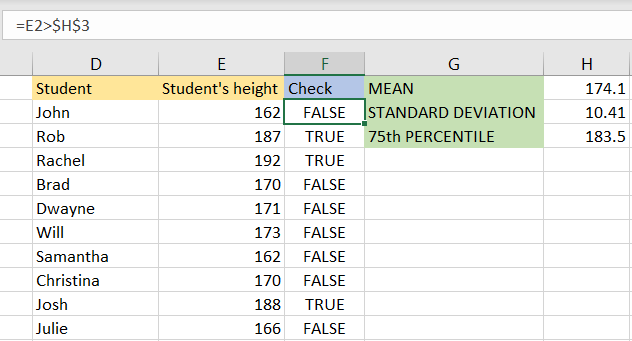
This number means that, if we use the 75th percentile as a threshold, every student whose height is over 183.5 (measures are in cm) will pass the threshold. Since we have 10 students in our table, and since the formula for percentile assumes that our data is equally distributed, this means that we will have three students above this percentage (25 percent of our number).
If we add the following formula in column F to check this:
|
1 |
=E2>$H$3 |
And expand it to the end of our range, these results will show: