Probabilities of events are stated as numbers ranging from 0 to 1. The closer the probability of a given event is to 1, the more likely it is to occur. The closer the probability of a given event is to 0, the less likely it is to occur.
Calculate Probability
To compute the probability of an event E, denoted P(E), is:
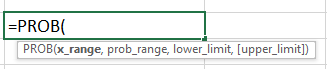
The PROB function is Excel’s built-in formula for calculating probability. The PROB function returns the probability that values in a range are between two limits or equal to a lower limit.
The function takes three required arguments and one optional argument.
Data needs to be prepared beforehand to obtain accurate probability results.
Calculate Probability with Lower and Upper Limits
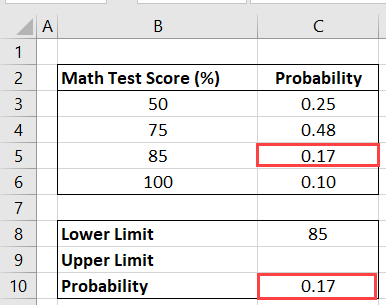
The following dataset contains a list of test scores on a Maths test and their corresponding probabilities. Notice that all the probabilities must add up to 1; otherwise, the PROB function returns a #NUM! error.
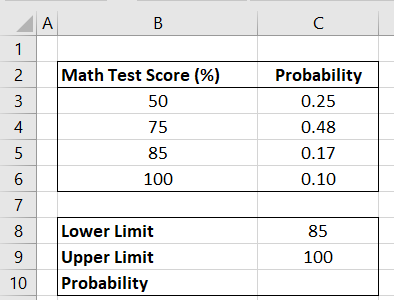
We want to compute the probability that a certain score is between 85 and 100.
We use the following steps:
- Select cell C10 and type in the following formula:
|
1 |
=PROB(B3:B6,C3:C6,C8,C9) |
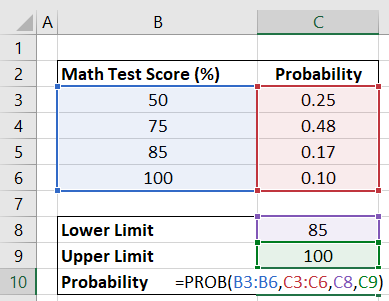
- Press Enter.
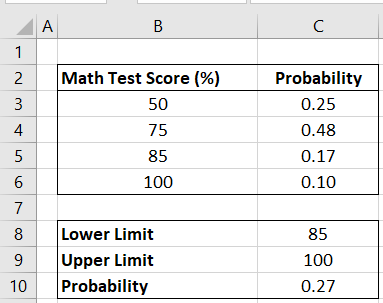
The probability of the scores falling between 85 and 100 is 0.27 or 27%.
Calculate Probability Without the Optional Upper Limit
The following dataset contains a list of test scores on a Maths test and their corresponding probabilities.
If we omit the upper limit argument, the PROB function returns the probability equal to that of the lower limit only.
Conclusion
This tutorial looked at calculating empirical probability in Excel using the PROB function. We hope you found the information helpful.