The most popular chart in Excel is Column Chart. It is located at the top of the chart list. The data in the column chart is displayed using vertical bars.
This chart uses one or more data series that will be placed one after the other. By default, each data series is filled with a different color.
Column charts are often used to compare to each other various elements that belong to different datasets.
Excel offers seven different types of column charts.
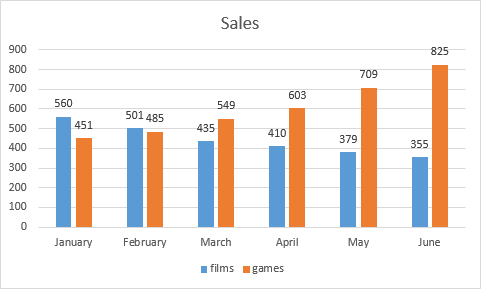
Clustered Column Chart
The following chart is the Clustered Column Chart. It shows the sales of movies and games for the first six months of the year. As you can see on the chart, despite the fact that in January the sale of the movies was above the sale of video games, in February this advantage decreased.
During the last four months, there has been a continuous decline in the sales of movies and an increase in sales of video games. In June, the sales of the games were twice as high as of the sale of movies.
Stacked Column Chart
In this case, the Stacked Column Chart will be helpful to show the total sales.
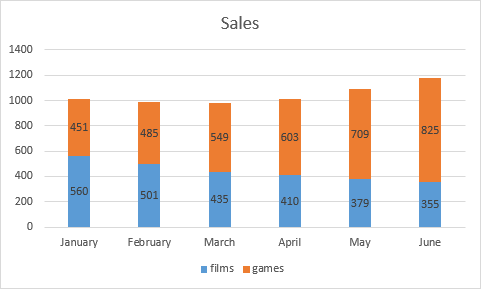
As you can see from the data in the chart, after the initial drop in total sales there was a brief stagnation in March, but in April and later months the sales increased again.
100% Stacked Column Chart
This type of chart doesn’t show quantitative data, but it shows what is the ratio of sales between movies and games.
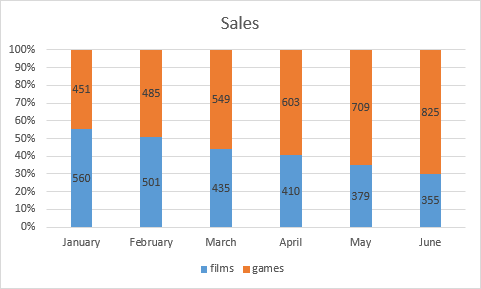
This type of chart is often a good alternative to pie charts because you don’t have to use different charts for each month.
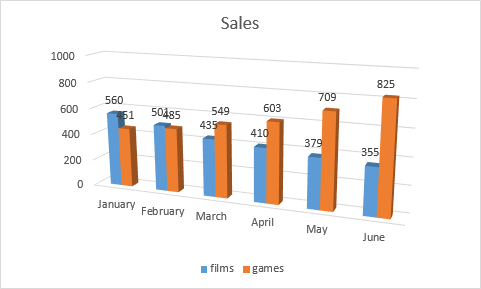
3-D Charts
The other four types of column chart are three-dimensional charts. In fact, those charts are still two-dimensional because they use two axes. They are called three-dimensional because they are shown in the 3-D view.
The 3-D chart is not very practical because it’s difficult to accurately determine the relationship between the data points. It can be used, for example, during the presentation, where accuracy is not as important.