Excel is a great tool for all kinds of analysis. It encompasses mathematical, statistical, financial, and many other formulas.
One of the most widely used statistical formulas is linear regression. As a result of linear regression, we can get an R-squared (R2) analysis. This is a statistical measure that is used to analyze if the fit of a linear regression model is good or not. This measure gives us insight into how well the independent variable, or variables in our model explain the variability or the dependent variable. Strictly statistically speaking, it quantifies the proportion of the variance in our dependent variable that can be predictable from the independent variable (s).
In the example below, we will show how R-squared analysis can be interpreted and how to use it in Excel.
R-Squared Analysis Specifications
In the context of linear regression, the R-squared analysis functions like this:
- Range of Values: R-squared values are ranging from 0 to 1. If we have a value of 0, this means that our model does not explain any variability in the dependent variable. If we have a value of 1, it means that the model perfectly explains the variability. It is important to have in mind that high R-squared values do not mean the model is the best fit, as we can have issues such as overfitting.
- Interpretation: If we have an R-squared value of, let’s say, 0.65, this means that 65 percent of the variability in the dependent variable is explained by our independent variable (or variables) that are included in our model. The rest of the 35 percent is unexplained, and this can be due to factors that are not included in our model.
- Comparative Analysis: R-squared analysis can and is often used to compare different models. If we have multiple models that predict the same dependent variable, we can compare their R-squared values. If we have a higher R-squared result, this indicates a better fit, although it is important to consider the complexity of the model we use and the number of independent variables.
- Limitations: As with every analysis, R-squared has its limitations. It cannot tell us if the coefficients of the model are significant from the statistical perspective, nor it shows us the causality between variables. It is also important to remember that even if we have a high R-squared value, it does not mean that we have a causal relationship.
- Adjusted R-squared: The adjusted R-squared is a modified version of R-squared that adjusts for the number of independent variables in the model. It penalizes the inclusion of irrelevant variables that may artificially inflate the R-squared value. Adjusted R-squared is often preferred when comparing models with different numbers of variables.
- Context: R-squared should always be looked at from the perspective of the context of a specific problem and field. In some fields, even relatively low R-squared values might be looked at as significant, while in some, a high R-squared might be expected.
- Visual Analysis: It’s also a good practice to visually inspect the scatter plots of your data and the regression line to get a sense of how well the model fits the data.
R-Squared Linear Regression Analysis in Excel
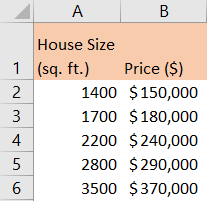
For our example, we will presume that we have a dataset of house prices and their corresponding sizes. In this example, we want to see if there is a relationship between the size of the house (presented in square feet) and the price of the house (presented in dollars). We presume that there is a linear relationship between these two variables.
First, we will prepare the data:
Second, we will create a Scatter Plot chart to visualize the relationship between the two variables that we have. Now, Excel is smart enough to recognize the trend that we want, so if we go to Insert >> Charts >> Recommended Charts we will see that the Scatter chart is the first one that is recommended:
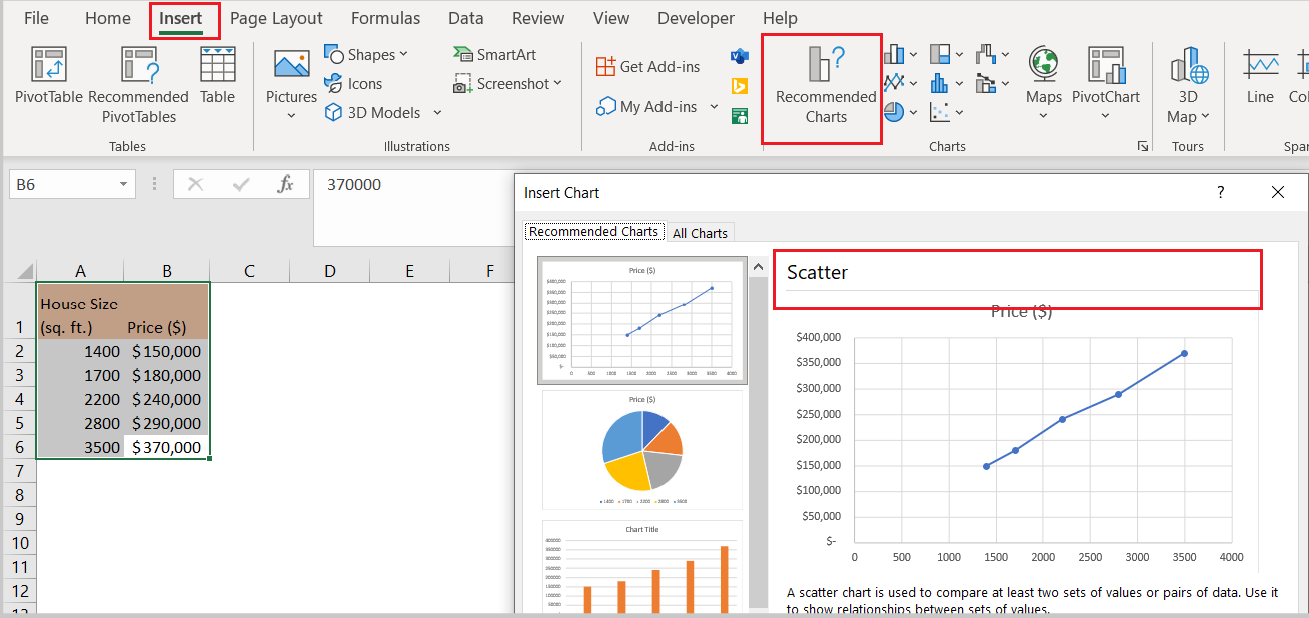
As seen, the chart that we will get will be the one on the preview, and in its description, it is stated that the scatter chart is used for showing the relationship between sets of values. And in our example, it is seen that there is a correlation.
For the next thing, we will calculate the R-Squared analysis.
There are two ways to calculate R-Squared in Excel. The easiest way is to use a built-in R-squared formula. An alternative way is to find the correlation and after that to square it.
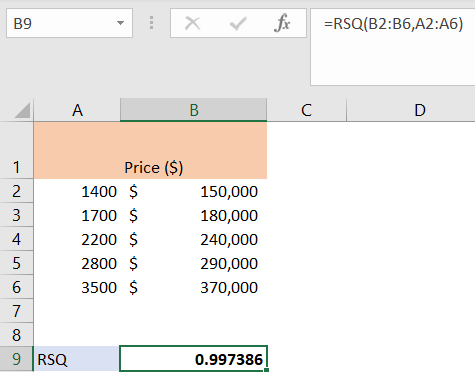
The inbuilt formula in Excel for R-squared is RSQ. This formula has two parameters: known_y’s and known_x’s. Our y’s are located in column B, and our x’s are located in column A, so our formula will be:
|
1 |
=RSQ(B2:B6,A2:A6) |
And our result will be 0.997386, as shown below:
Using Data Analysis
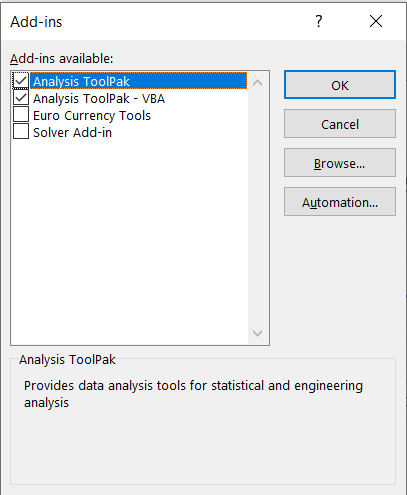
We can also use a simpler way to get all the numbers needed from linear analysis, which is Data Analysis. To add it to the Data tab, we will go to the File tab >> Options >> Adds In, and will add Analysis ToolPack:
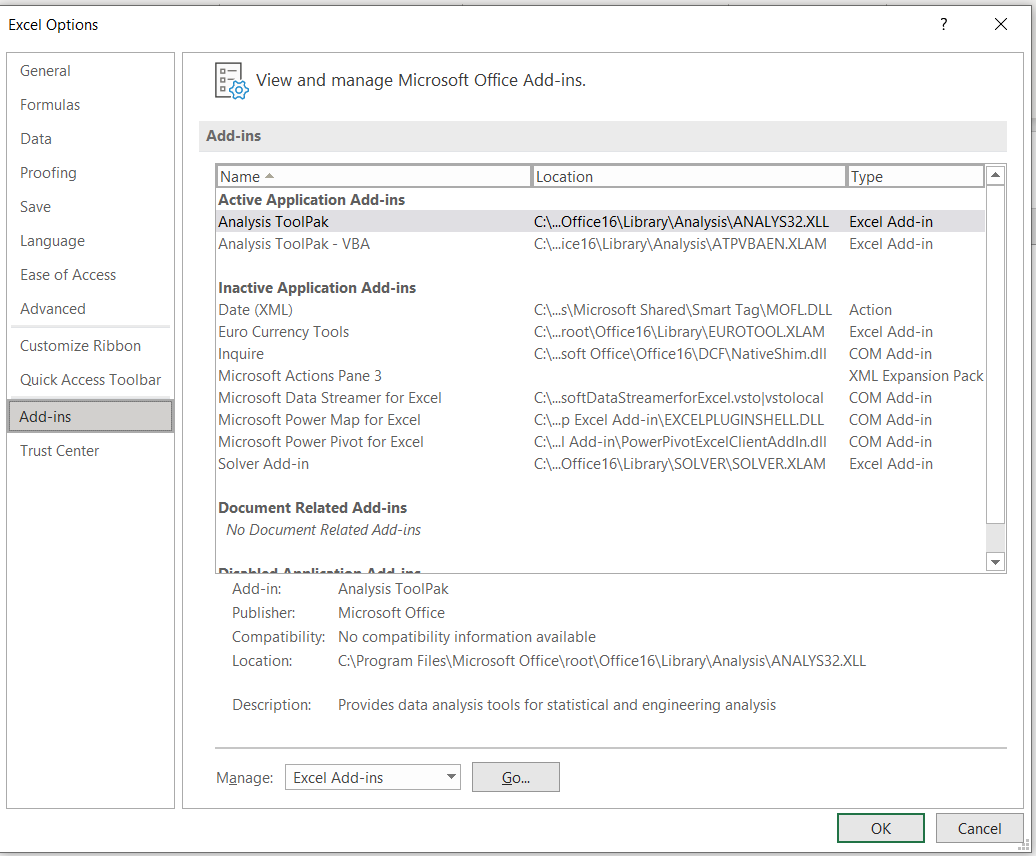
We will click the Go button, and add the Analysis ToolPak:
Once we do, we will have Data Analysis in the Data tab:

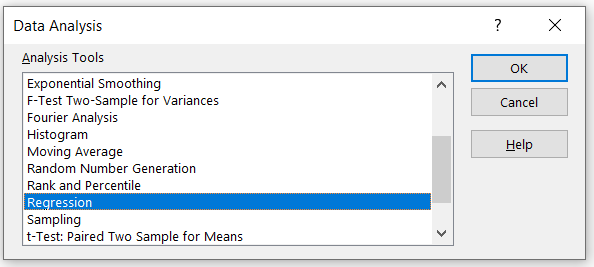
After choosing Data Analysis, we will choose Regression:
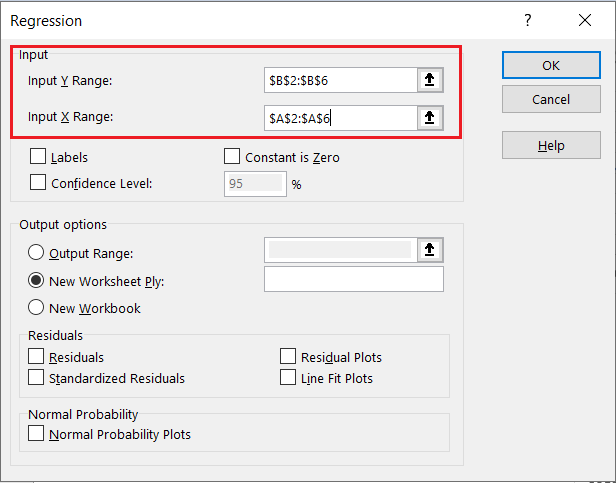
When we click OK, the dialog box will appear. We will choose our Y range and X range:
When we click OK, another sheet will appear, on which the whole linear regression analysis will appear, along with R-squared analysis values:
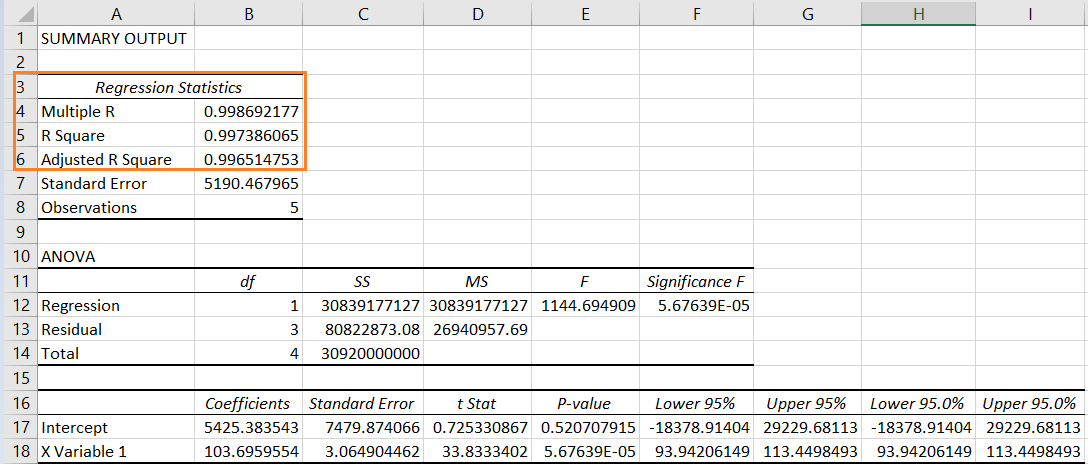
Whatever we decide to do, and regardless of the calculation, it is important to know how to interpret the R-squared value. If the value is closer to 1, it indicates that a larger proportion of the variability in house prices can be explained by house size, implying a relatively good fit. In our case, this is the case.
Remember that while R-squared provides useful information about the goodness of fit, it should not be the sole determinant of the quality of our model. Other factors such as residual analysis, statistical significance of coefficients, and domain knowledge should also be considered when interpreting and analyzing the results of a linear regression, as is the case in the Excel sheet we got above.