As a computing tool, Excel can offer various adequate and automatic solutions for many of our problems. There are multiple options that can help us with calculations as well.
One of these helpful things is Data Table. In the example below, we will show where to find them and how to use them.
Find and Use Data Table in Excel
To show how just useful Data Tables are in Excel, we will create an overview of the profit of a certain company that sells certain items, but has also a fixed cost of creating the items and a variable unit cost:
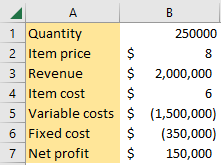
In the table above, we have set quantity, price, item cost, and fixed cost. Revenue is calculated as a product of the quantity and price of the item. Variable cost is calculated as a product of quantity and cost of item (it will always be a negative number), and net profit is calculated as revenue – variable cost – fixed cost.
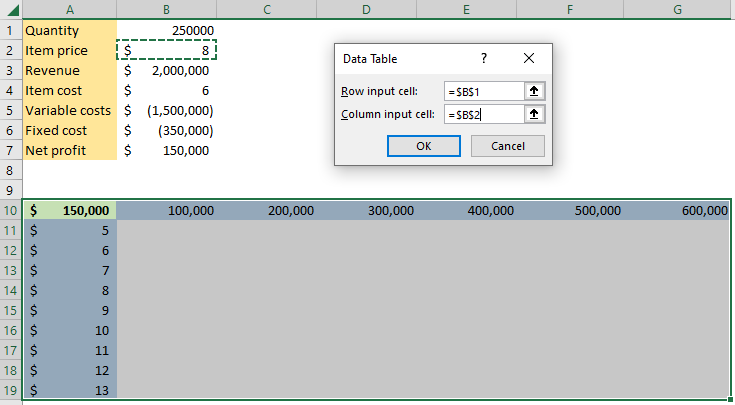
We will create a table below the existing one, in which we will put various quantities on different columns, and various item prices in row A:
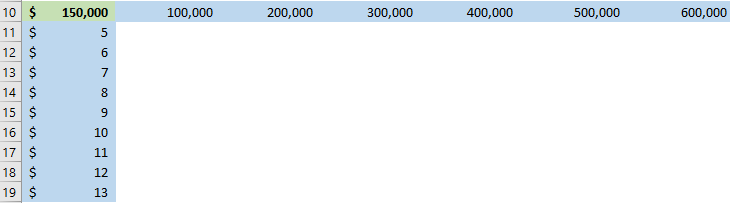
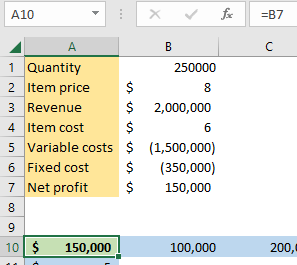
In the table above, we can notice one number colored in green- $150,000. This is the number that is equal to the net profit in the first table:
Other numbers that we have put in basically present different scenarios of quantities and item prices, which will help us to create a matrix and see at what level the company is profitable. To do this, we will use Data Table.
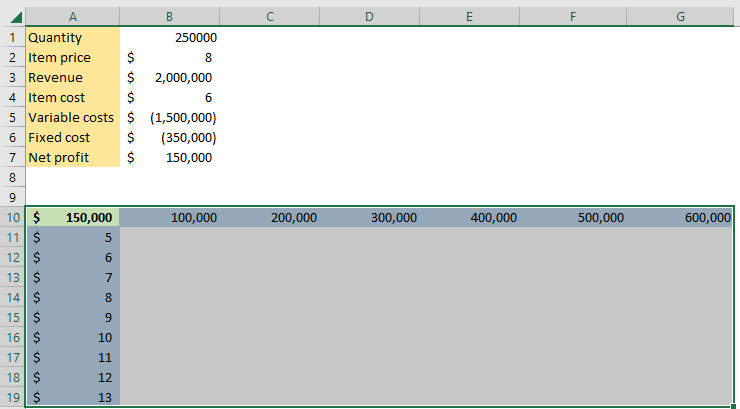
We will select the entire table: range A10:G19 in our case:
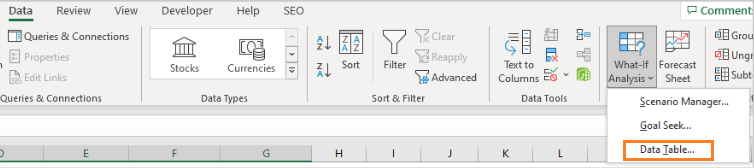
To find the Data Table, we then go to Data >> Forecast >> What-If Analysis >> Data Table:
In the window that appears, we will choose to insert cell B1 under the Row input cell (for quantity), and cell B2 as a Column input cell (for item prices):
After we click OK, we will get our end results, as follows:
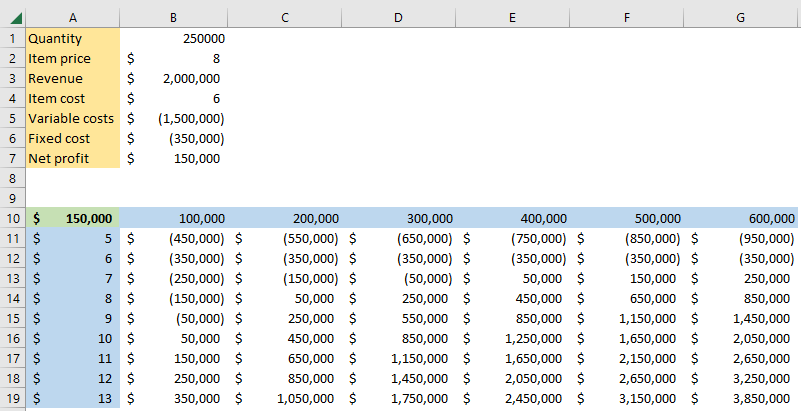
In this table, we now have net profit calculated in the matrix. For example, we can see that, to achieve a profit when selling 300,000 units, we need to set a price of $8. In our formula, fixed costs and item costs are always the same. Variable costs change as quantities change.