When dealing with data in Excel, there is always a way to group the data by any criteria that we want. We can do this by turning on the Group Mode.
Group Mode is used to group and summarize the range of cells or our data in the worksheet. It allows us to collapse or expand these rows and columns to create a more condensed and specific view of the data, allowing us to analyze and manage large sets of information.
In the example below, we will show how this can be done.
Use Group Mode in Excel
All of the data in Excel is presented in rows and columns. Grouping is done by being applied to either rows or columns. If you group your data by rows, you collapse the data into a single row or expand it to reveal detailed data that it consists of. The same thing is with columns- you collapse data into a single column or expand them to view the specific data.
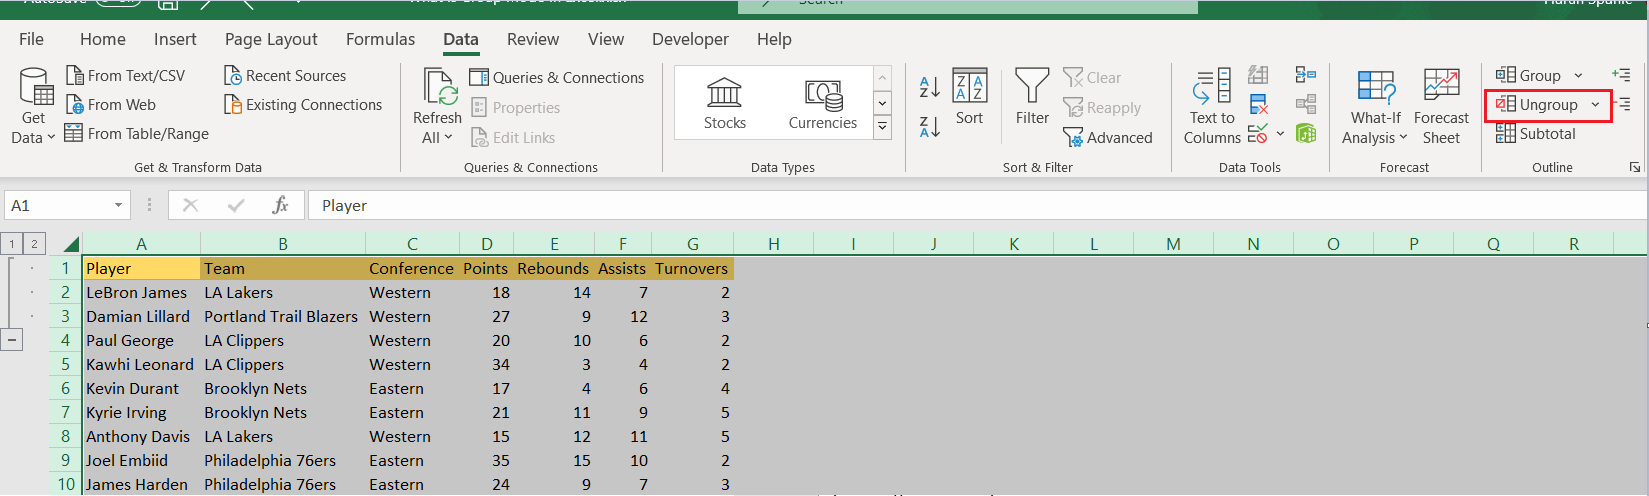
For our example, we can use the list of NBA players:
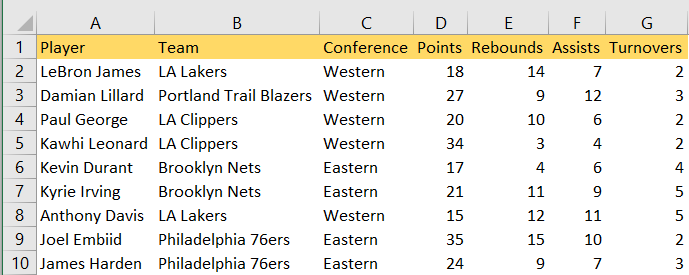
Now, let’s say that we want to group only the first two-three rows (titles and first two players). We will select them, and then go to the Data tab. In the Data tab, we will search for the Outline, and in the Outline, we will find the Group option.
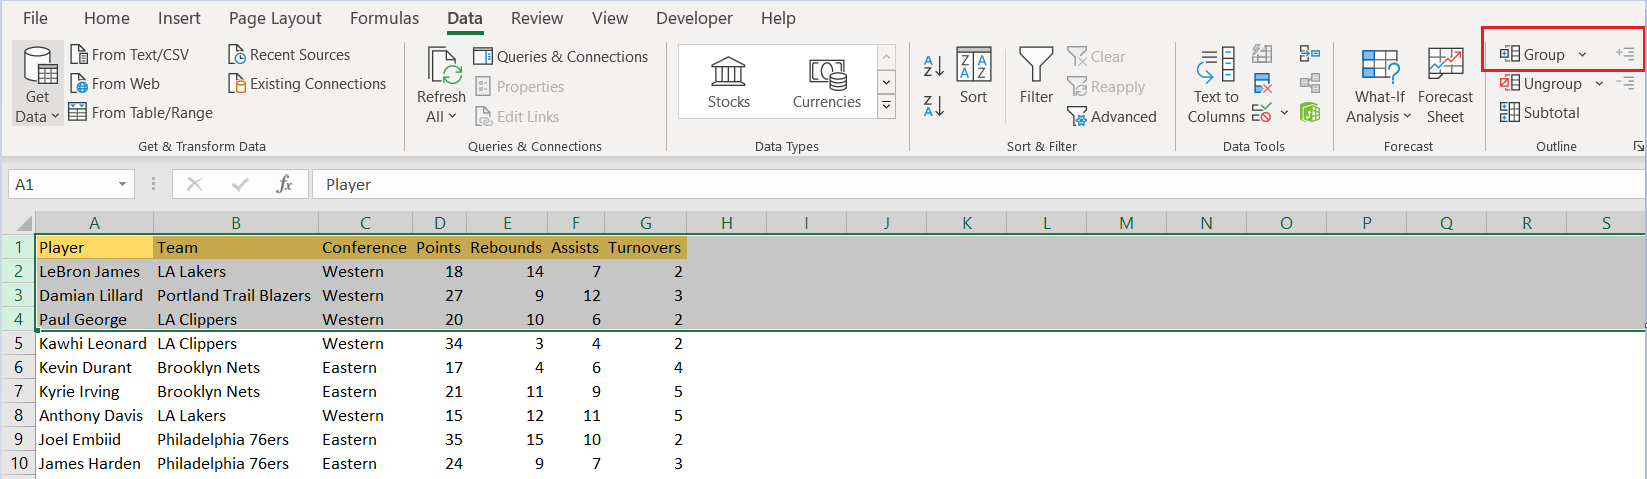
We will click on the Group and will have our data grouped by rows. Excel will add group symbols (numbers or plus/minus signs) on the left side of the grouped rows. These will be great tools to expand or collapse the grouped sections.
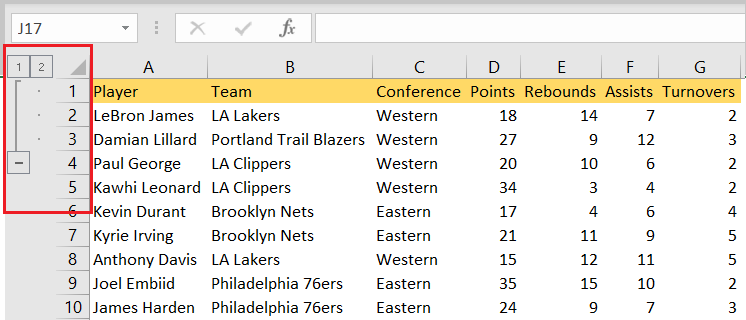
To collapse our data, we will press the minus sign, and have the following data shown:
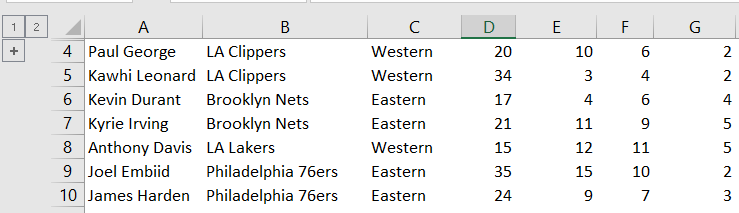
To see our original data again, we will click on the plus sign. With this, we will have our data shown and expanded again.
To ungroup our data again, we will select it, and click on the Ungroup option:
To do the same thing with columns, or in general, to get to the grouping option from wherever we are, we will simply go to Data >> Outline >> Group, and will get the pop-up:
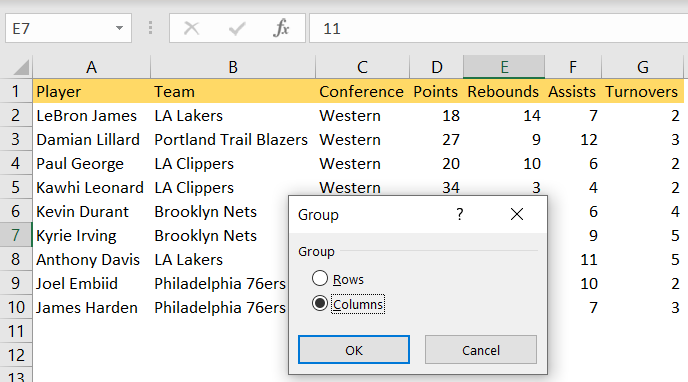
Since we are positioned in column E if we choose Columns and OK, we will have only column E collapsed.