You might have heard about the statistical measure called percentile and its related term percentile rank. These two measures are used in reporting in various cases.
A percentile rank is a measure that shows the relation between a certain score comparing with the scores of the group.
For example, if a certain basketball player averages 25 points, and is ranked in the 90th percentile, this means that his average is higher than that of 90 percent of the rest of the players.
In the example below, we will show how to calculate the percentile rank in Excel.
Calculate Percentile Rank in Excel
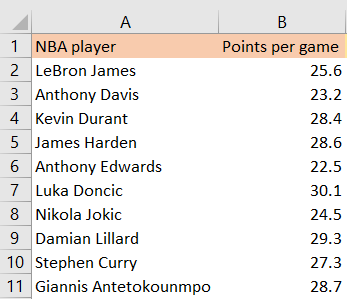
For our example, we will use the list of NBA players and their points averages:
To calculate the percentile rank, we will use a very intuitive formula- PERCENTRANK. The formula that we can use can be either PERCENTRANK.INC (include the first and last value) or PERCENTRANK.EXC (excluding the first and last value, which means we will not have a 0% or 100% values).
We will use the PERCENTRANK.EXC formula which has three parameters:
- Array- the range that we want to inspect
- x- the value out of which we want to get the percentile from
- Significance- not a mandatory field. The value that tells the number of digits that are important to be returned as a percentage value. If we do not choose to insert it, it uses three digits.
Having all of this in mind, this is the formula that we will insert in cell C2:
|
1 |
=PERCENTRANK.EXC($B$2:$B$11,B2) |
Numbers in our array will be locked, to allow us to auto-fill the data till the end of the table, and value x will be changed as we drag the data. These are our results:
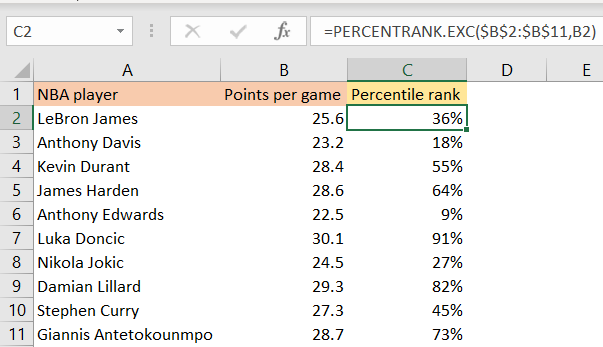
In our case, Damian Lillard has a percentile rank of 82 percent (for example), meaning that only 18 percent of players in the data set have a higher points average.