A LINEST function is a great tool that can be used in Excel or Google Sheets. With this function, we can perform linear regression analysis and also calculate various statistics that relate to a linear trendline that fits the best to a given set of data points.
This function will return the array of values. Each of these values presents different statistical information.
In the example below, we will show how this function works and how to use it in the example.
LINEST function explained
The syntax for the LINEST function is as follows:
|
1 |
=LINEST(known_ys, [known_xs], [const], [stats]) |
The explanation of every parameter is as follows:
- Known_y’s: This is a parameter that stores the array of a range of dependent variable data (Y-values) for which we aim to find the best-fit line. This parameter is mandatory.
- Known_x’s: This parameter is optional and represents the array of a range of independent variable data (X-values). If we do not provide it, the function will assume a series of sequential integers that will start from 1 as the X-values.
- Const: Another optional parameter specifies if we want to force the constant (Y-intercept) of the regression line through the origin (0). If we use TRUE or 1 we will define that the regression line will go through the origin. If we use FALSE or 0, the regression line will have a Y-intercept other than 0. If we do not insert any value, the default value is TRUE.
- Stats: Final optional argument which specifies if are there any additional statistics that can be included in the output. It is an array constant that we can use to extract the statistics like R-squared, standard errors, etc. If omitted, the function returns the slope and Y-intercept of the regression line.
To use the LINEST function, we need to keep in mind the following:
- We need to organize your data and have a set of data pairs (X, Y) in the columns next to each other.
- Our data ranges must be determined. Arrays for X-values and Y-values should be noted.
- Only when the first two are met, we can enter the LINEST formula.
- In the previous versions of Excel (versions older than Office 365 and non-online versions), we would need to press CTRL + SHIFT + ENTER to make this formula work, as it is an array formula. In newer versions, we do not have to do it.
How to use the LINEST function
For our example, we will make a list of data, consisting of the grades of several students in Mathematics and History:
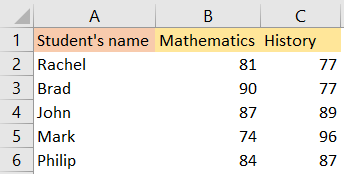
Our goal is to find the relationship between Math and History grades and to check if there is any linear correlation between the two.
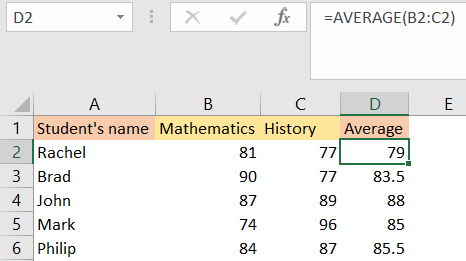
To achieve this, we will first calculate the average for each student across the two subjects (this is an option step, but we do it to simplify the dataset). For this, the new column Average will be added, and in that, the average of two grades will be calculated:
We will now use the LINEST function to perform the linear regression analysis and we will try to find the best-fit line for the relationship between Mathematics and History.
We will use the following formula and put it in cell E2:
|
1 |
=LINEST(C2:C6, B2:B6, TRUE, TRUE) |
and will get the following results:
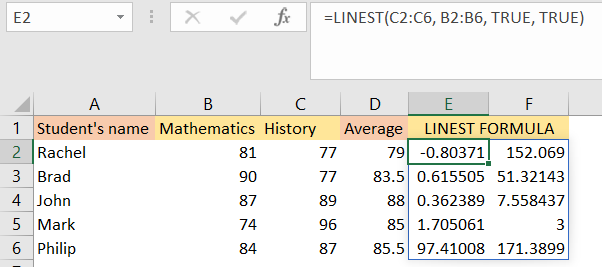
In our formula, C2:C6 are History grades (dependent variable) and range B2:B6 represents the Mathematics grades (independent variable). Our third parameter will be TRUE to force the regression line through the origin (0), as well as the fourth one to include additional statistics like R-squared.
Since we use the 365 Office version, we do not have to press CTRL+SHIFT+ENTER to make the formula work. In older Office versions, we would have to do it.
The results that we got are an array containing the slope, Y-intercept, standard error of slope, standard error of Y-intercept, R-squared, and other requested statistics:
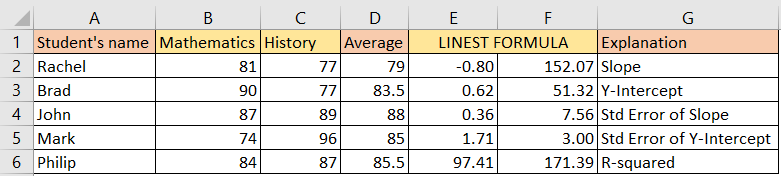
Looking at the column E, explanations are as follows:
- The Slope represents the change in the History grade for a one-unit increase in the Mathematics grade.
- Y-intercept gives us the expected History grade when the Mathematics grade is 0 (this one is not practical in our example).
- The R-squared value shows how well the linear regression line fits the data (higher values indicate a better fit).
The LINEST function in this example is used for a simple linear regression analysis that only has two variables. If you have more complex scenarios, you should consider multiple regression analysis or some other statistical methods.