There are different ways to calculate averages in Excel, and usually, people are using formulas such as arithmetic mean and median. Sometimes, these formulas are not the best solution. If we talk about the quantities which are inversely proportional, for example, rates and ratios, the harmonic mean is probably the best measure to use for a central tendency.
In the example below, we will show how to calculate the harmonic mean in Excel.
Calculate Harmonic Mean in Excel
To show this in the example, we will calculate the harmonic mean of 2 and 4. When we put these numbers in Excel, in column A, and use the following formula:
|
1 |
=HARMEAN(A2,A3) |
We will get the following result:
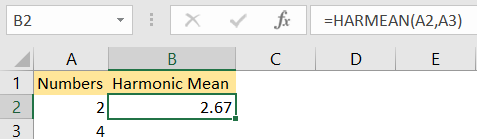
This formula first finds the reciprocal of each number, which means that the numbers need to be divided by 1. The reciprocal of number 2 is ½, and of number 4 is ¼. The next step is to add these numbers together. For the final step, we need to divide this sum by the number 2 (we have two numbers in our set). The result will be 2/3 or 2.67.
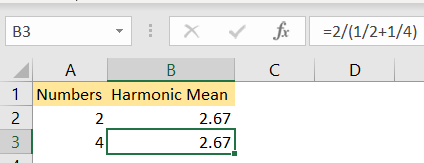
To illustrate this, we will insert the following formula in cell B2:
|
1 |
=2/(1/A2+1/A3) |
And we will have the same results:
Harmonic Mean Formula for Grouped Data
The formula above works for the group of numbers, but what should we do in the case when we have grouped data, i.e., the data that is divided into intervals or classes? In this case, we need to create a different formula.
We need to find the midpoint of each and every class interval, and then the reciprocal of every midpoint. Then, we multiply every reciprocal by the frequency of the corresponding class, sum all of the products, and then divide that sum by the total frequency of the data. This formula is called the harmonic mean of grouped data.
It sounds very complicated but can be better explained in the example, so we will do just that.
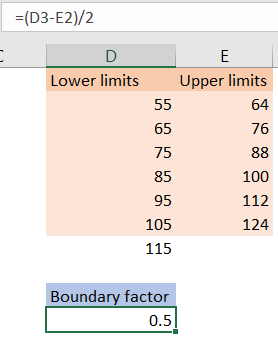
The first thing we need is grouped data, in our case, limits. We will have the list of numbers that are referred to as lower limits, and numbers that are considered to be upper limits:
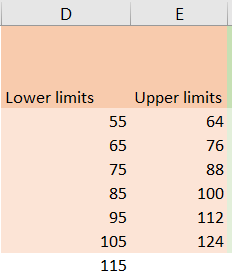
Now we need a boundary factor, which will be calculated as the difference between the second number in lower limits, and the first number in upper limits, divided by 2. In our case, it will be equal to (65-64)/2, which is 0.5:
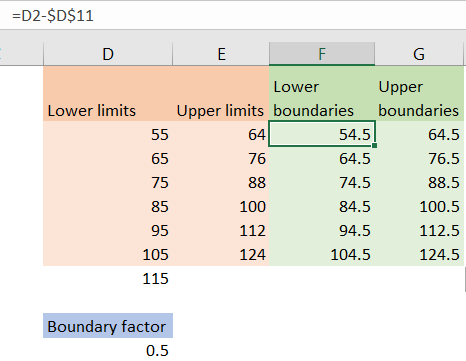
For the next thing, we need to subtract the boundary factor from the numbers in lower limits to calculate lower boundaries and add the boundary factor to the numbers in upper limits to calculate upper boundaries. When we do that, we will get the following results:
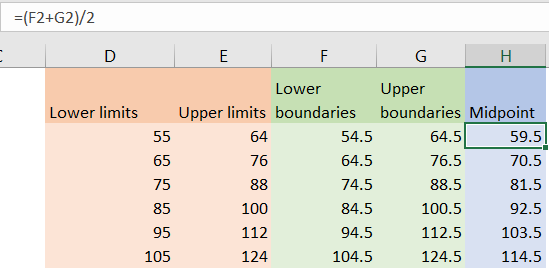
We have all the data needed to calculate the midpoint, which will be a sum of numbers in lower boundaries and upper boundaries divided by 2:
Now we need to add frequency. We will use random numbers, and then divide the frequency with midpoints:
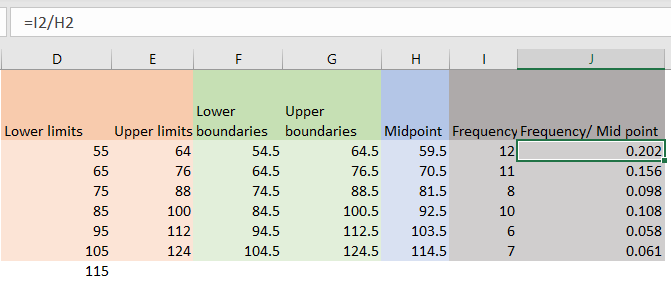
Finally, to calculate the harmonic mean of grouped data, we need to sum all the frequencies, sum all the data in the frequency/midpoint column as well, and then divide these two numbers:
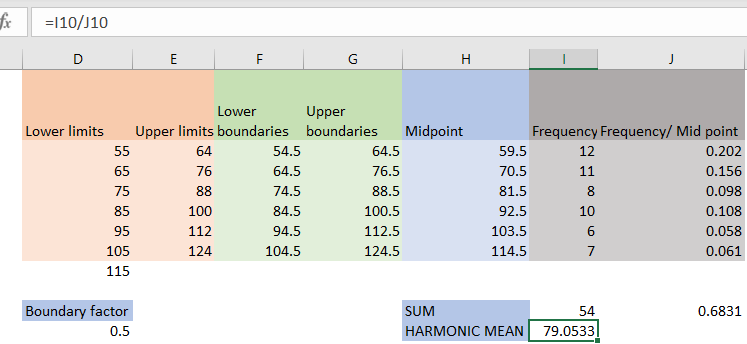
We will get the result of 79.053.
Harmonic Mean vs Arithmetic Mean
The harmonic mean is slightly different from other average formulas in Excel and has its own properties. One of the most critical properties of the harmonic mean is that it is always less than or equal to the arithmetic mean of a set of specific data. This means that it can be a better representative of the average of the data set than the arithmetic mean if the set of data is inversely proportional.
One more property is that the harmonic mean is the reciprocal of the arithmetic mean of the reciprocals of a specific set of positive numbers. This means, if we have the reciprocal of every number in a set, then we calculate their average and find the reciprocal of that average, we will get the harmonic mean of the original set as a result.
Weighted Harmonic Mean Formula
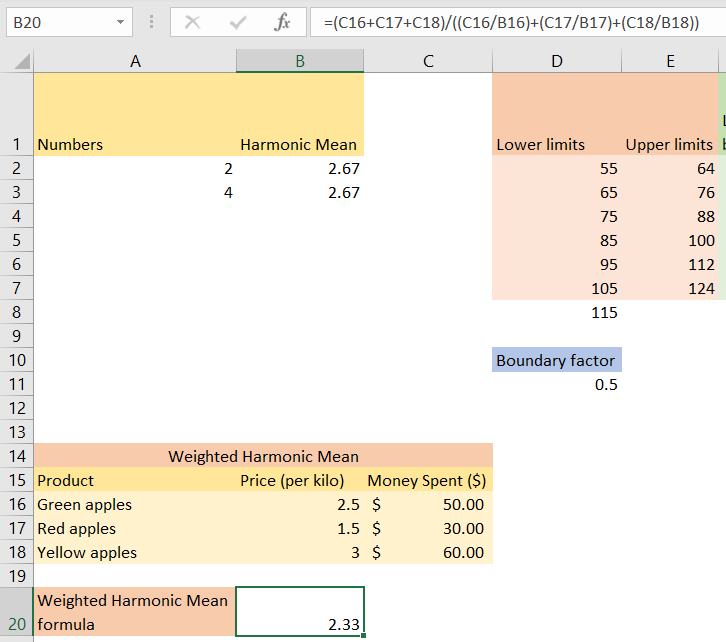
When you find yourself in a situation where you need to assign weights to values in a data set, you have to use the weighted harmonic mean formula. For our example, let’s say that we have three variants of apples (green, yellow, and red), their prices, and the money spent on them:
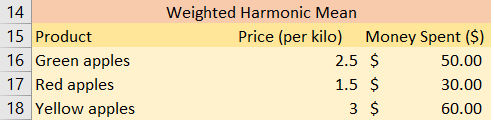
If we want to calculate the weighted harmonic mean of the apple prices, you need to use the formula that will do the following:
- Sum the money spent
- Calculate the average price of every product (for green apples it would be 50/2.5, so 25) and then sum those numbers
- Divide these two numbers
When we apply this formula in Excel it will be:
|
1 |
=(C16+C17+C18)/((C16/B16)+(C17/B17)+(C18/B18)) |
And we will get 2.33 as our result: