There are a lot of statistical measures and terms that are used and can be calculated using Excel. One of these terms is normal distribution. It is also known as Gaussian distribution, and it gives us the probability distribution that is symmetric about the mean. What it shows is that the data near the mean occur more often than data far from the mean.
In the example below, we will show how to calculate the probability of a value occurring in a normal distribution.
Calculate Normal Distribution Probability in Excel
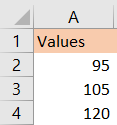
For our example, we will use three values that will be located in column A:
To calculate the probability of a certain value lined above occurring in a normal distribution, we will use NORM.DIST function. This function takes into account the value for which we are finding the probability, the mean, and the standard deviation, and checks if we want the cumulative distribution or the probability density.
The syntax for the NORM.DIST function is as follows:
|
1 |
NORM.DIST(x, mean, standard_dev, cumulative) |
In this formula:
- X: It is the value for which we want to calculate the probability.
- Mean: Mean of the normal distribution.
- Standard_dev: Standard deviation of the normal distribution.
- Cumulative: Logical value that indicates if we want a cumulative distribution (we will get this if we set the value to TRUE), or probability density (we will get this if we choose FALSE).
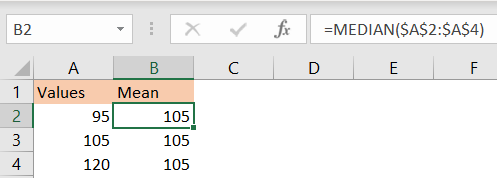
For our example, we have the X values, but we are missing the rest of the data. We will calculate the mean using the MEDIAN formula in column B, using the formula:
|
1 |
=MEDIAN($A$2:$A$4) |
And will get the result 105:
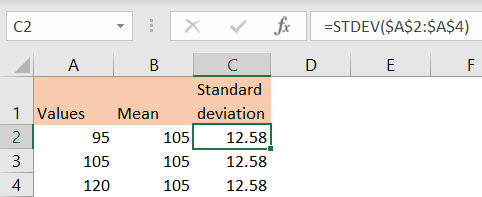
We also need to calculate the standard deviation, and we will do it by inserting the following formula in cell C2:
|
1 |
=STDEV($A$2:$A$4) |
And we will get the result of 12.58:
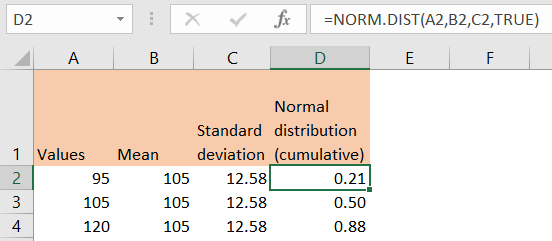
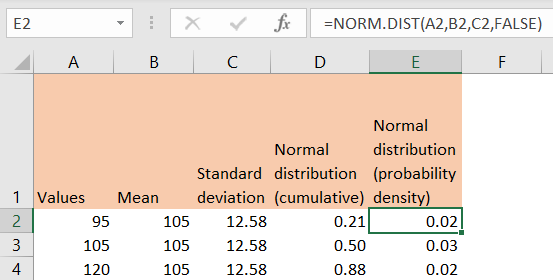
Now, for the final part, we will calculate the normal distribution probability for our values with cumulative distribution in column D by using the following formula:
|
1 |
=NORM.DIST(A2,B2,C2,TRUE) |
And will get the following results:
And one more for probability density (using FALSE) in column E:
Interpreting the Results of Normal Distribution Probability
The NORM.DIST function gives us us the probability of a certain value occurring in a normal distribution. The result will tell us the probability of the random variable from a normal distribution being less or equal to a specific value.
To interpret the result, values between 0.5 and 1 (for example our value of 0.88) indicate that the value we are calculating the probability for is somewhere between the mean and the right tail of the distribution.
Values between 0 and 0.5 (in our case, 0.21) indicate that the values we are calculating the probability for are somewhere between the mean and the left tail of the distribution.
To summarize, the NORM.DIST function gives us insight into the likelihood of a random variable being below a certain value in a normal distribution. This information is useful for making statistical inferences, setting confidence intervals, and understanding the behavior of random variables within a normal distribution context.